Stream Flows
The yearly summary for the USGS gage near Franktown, Colorado, at the far south of the Cherry Creek watershed listed an annual total flow of 1,570 AF with and an Annual Daily mean of 4.3 AF for WY 2018, which is approximately 47 percent of the annual mean discharge of 9.1 AF calculated from WY 1940 - WY 2018.
The yearly summary for the USGS gage near Parker, Colorado, listed an annual total flow of 3,807 AF and an Annual Daily mean of 10.4 AF, which is approximately 92 percent of the annual mean discharge of 11.3 AF calculated from WY 1992 - WY 2018.
The headwater flows of Cherry Creek were 53% less than average but flows were only 8% less than average by the time the stream reached the USGS near Parker site downstream.
Proportion of Flows into Cherry Creek Reservoir
Cherry Creek contributes the majority of surface water that flows into the reservoir.
The Authority’s continuous recording gage at site CC-10, just upstream of the reservoir on Cherry Creek, totaled 16,407 AF in WY 2018 with an average daily discharge of 22.7 cfs. The estimated WY 2018 flow at the CT-2 monitoring site located upstream of the reservoir on Cottonwood Creek totaled 3,228 AF with an average daily discharge of 4.5 cfs.
Useful Links
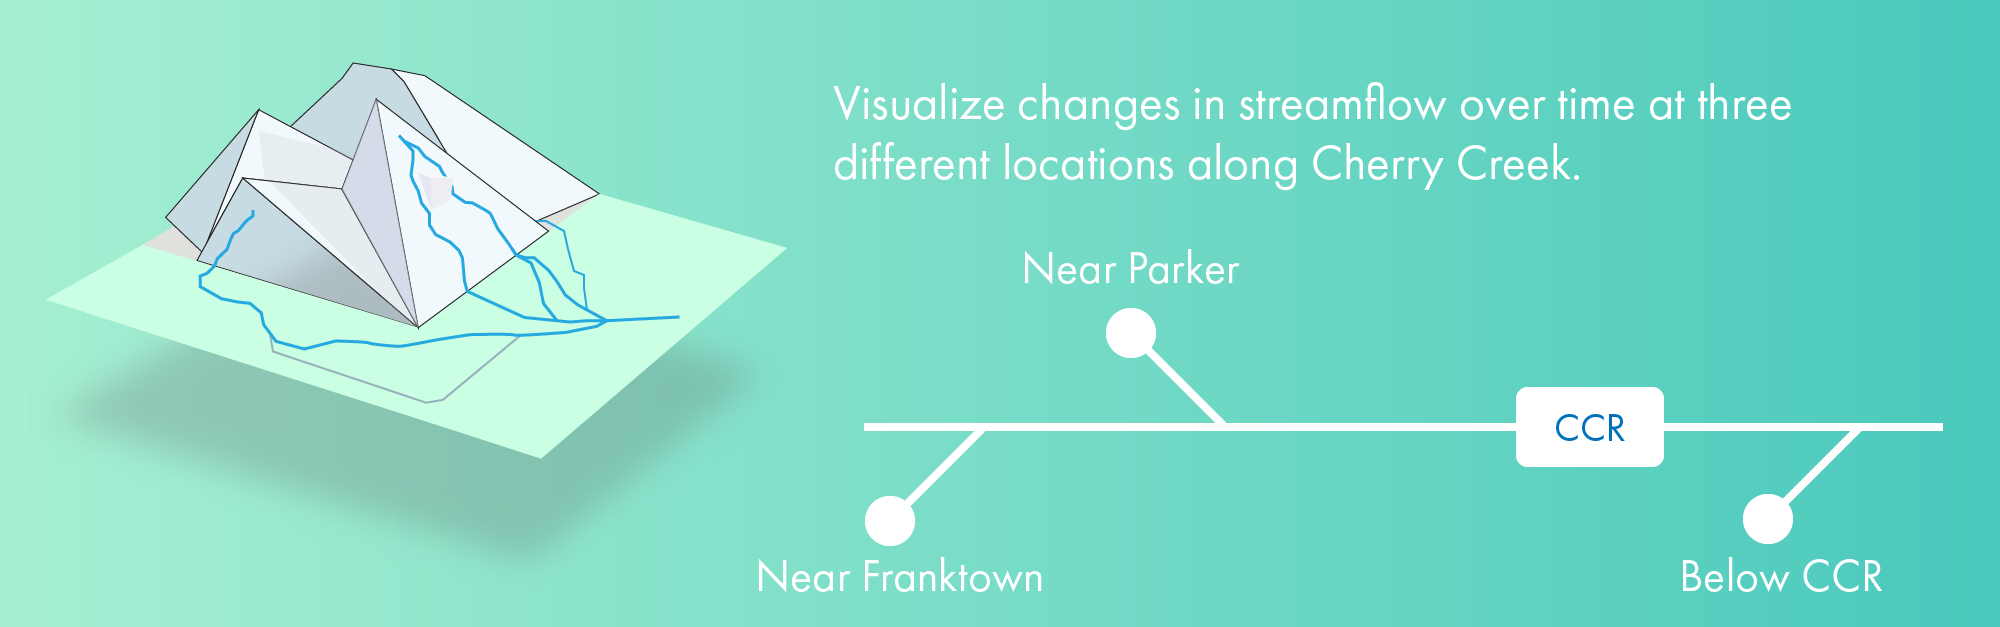
info_outlineVisualize streamflow over time at three different sites along Cherry Creek. The sites are ordered from most upstream to most downstream.
Hey! This page is interactive.
- Change the start and end dates to look at different time periods.
- Click a site name to display the USGS graph for that site.