Temperature, Dissolved Oxygen, and pH Depth Profile
The reservoir met the temperature standards established for the Class I Warm Water Aquatic Life use classification in Regulation No. 38 of 29.2 ˚C for the Maximum Weekly Average Temperature (MWAT) and 32.5 ˚C for the Daily Maximum (DM). The maximum temperature measured in the surface profiles was 24.6 ˚C on July 10, 2018. During this date the total change in temperature was approximately 4 degrees celsius from top to bottom of the reservoir, indicating that although there was some variability from the surface to the bottom in the warmer summer months, overall the reservoir experienced very little thermal stratification.
Dissolved oxygen (DO) concentrations met the standard of 5.0 mg/L throughout WY 2018 in the top layers of the reservoir. Under the standards, the DO may be less than 5.0 mg/L near the bottom as long as there is refuge with DO levels greater than 5.0 mg/L available for aquatic life. A few times levels from 5m to the bottom were less than 5.0 mg/L; however, during those times, the majority of the reservoir had DO levels that exceeded 5.0 mg/L providing adequate habitat (refuge) for aquatic life. Periods of low dissolved oxygen indicate high microbial activity or decomposition in the sediments which reduces DO concentrations.
During WY 2018, the pH ranged between 7.7 and 8.6, which meets instantaneous minimum and maximum standards of 6.5 and 9.0, respective.y. The higher pH values appeared to correlate with higher productivity and elevated chlorophyll α in the reservoir.
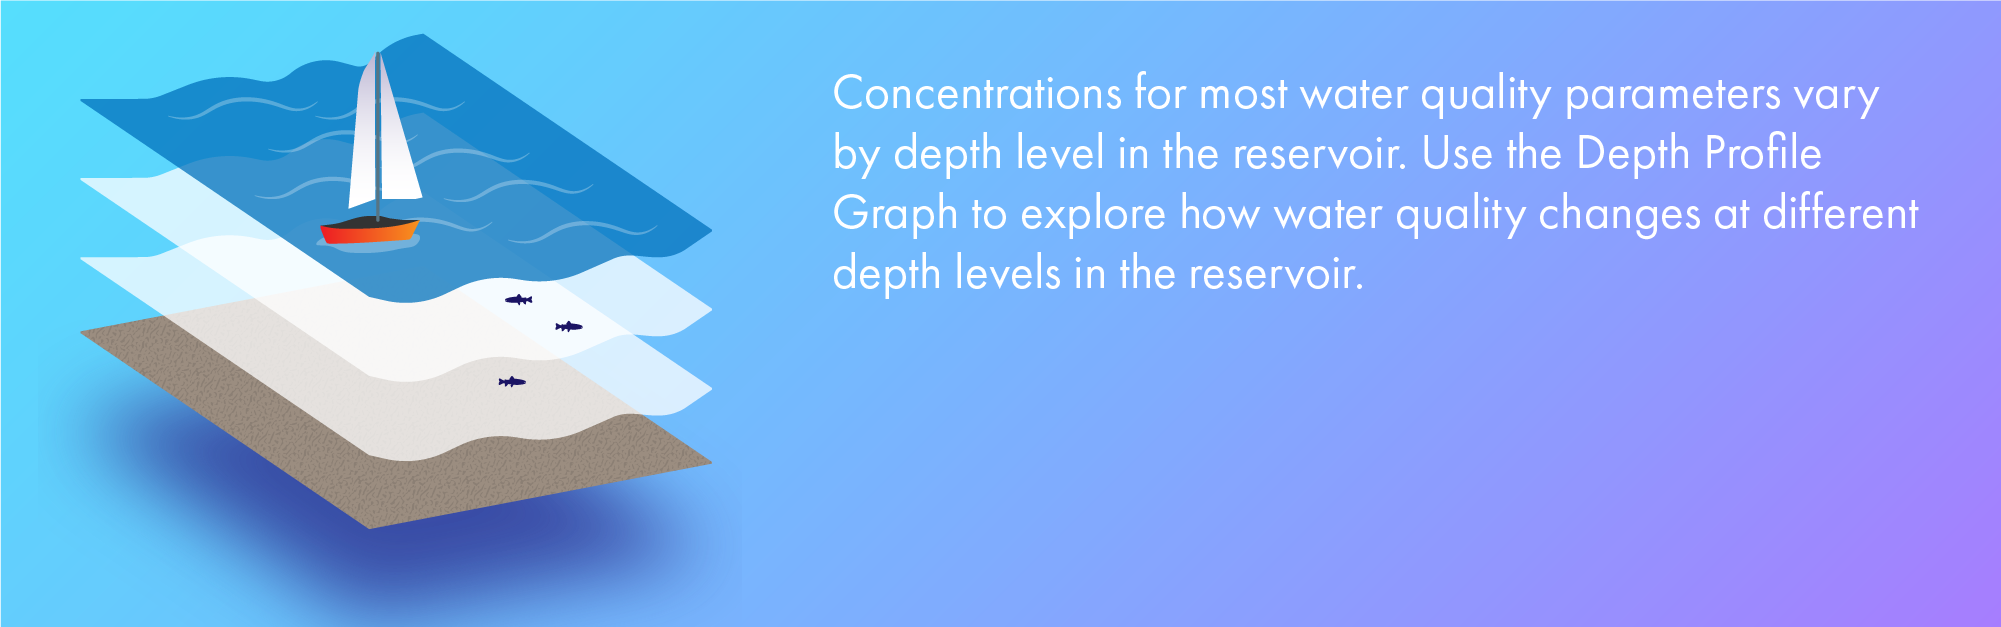
Reservoir Depth Profile: Temperature, Dissolved Oxygen, and pH
info_outlineEach square on this depth profile represents a sampling event. The different square colors represent the magnitude of the the value for the a sampling event. To learn more about a specific data point, hover over a square with your mouse.
Hey! This page is interactive.
- Change the start and end dates to look at different time periods
- Investigate different parameters using the parameter dropdown list
- View different locations using the surface water location list
- To learn more about a specific data point, hover over a square with your mouse.