Surface Water Inflow
Highlights:
The Cherry Creek sub-basin is the largest in the watershed (234,000 acres) and contributes the majority of streamflow into the Reservoir. Cottonwood Creek, the next largest source of inflows into the Reservoir, has a sub-basin of 9,050 acres, approximately 4% of the total watershed.
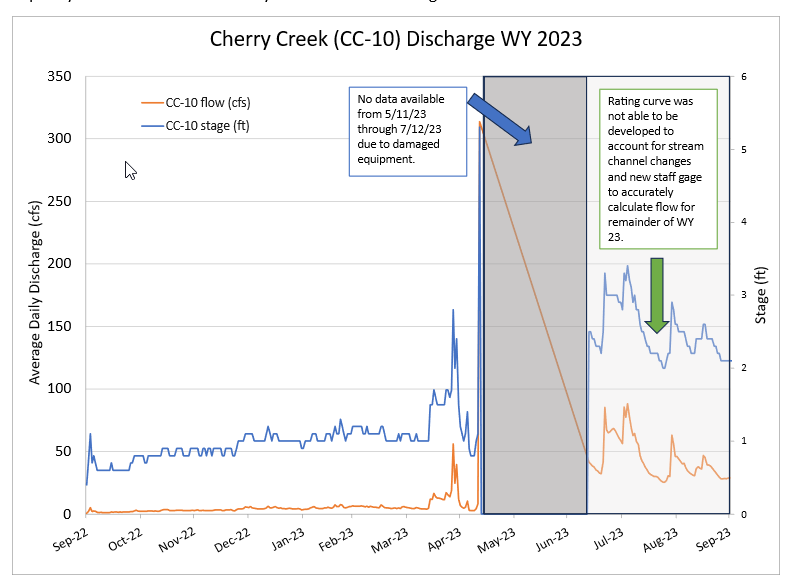
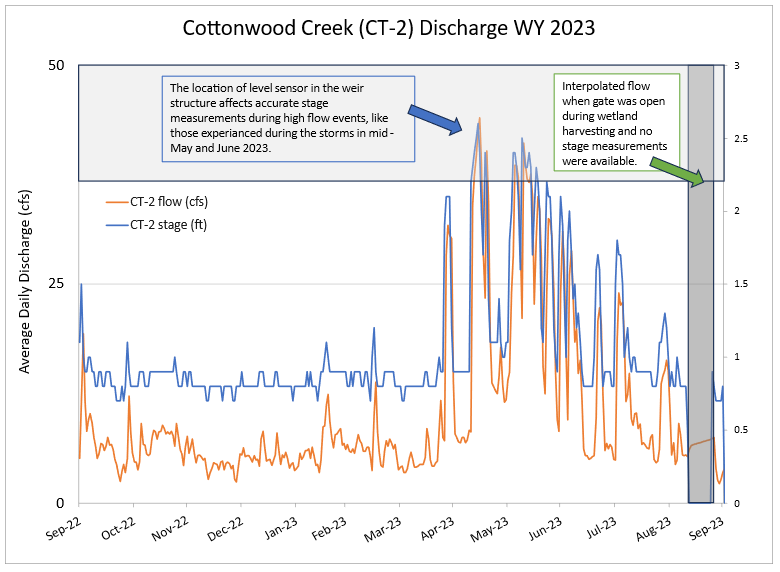
The multiple large storm events in the Cherry Creek Watershed during 2023 affected stage measurements and associated flow calculations due to damaged equipment and inaccurate readings at the two stations on Cherry Creek and Cottonwood Creek upstream of the Reservoir that are used to calculate inflows (CC-10 and CT-2, respectively). These values will be calculated based on Reservoir storage and relative inflows and included in an amended report later in 2024.
Proportion of Surface Water Inflow into Cherry Creek Reservoir (5 Year Average)
CCBWQA Cherry Creek (CC-10 and Lakeview Drive) Streamflow Monitoring WY 2023 Statistics:
Drainage Area: 366 square miles
Total Annual Flow:TBD AF
CC-10 Annual Flow: TBD AF
Lakeview Annual Flow: TBD AF
CC-10 Annual Daily Mean Flow Rate: TBD cfs (TBD AF/day)
Percent of 5-year (2017-2023) Average Discharge: TBD %
CCBWQA Cottonwood Creek (CT-2) Streamflow Monitoring WY 2023 Statistics:
Drainage Area: 14 square miles
Total Annual Flow: TBD AF
Annual Daily Mean Flow Rate: TBD cfs (TBD AF/day)
Percent of 5-year (2017-2023) Average Discharge: TBD %
More CCBWQA streamflow gage station details, including additional sites, can be found on the CCBWQA Stream Logger Data Viewer.
Useful Links