CCR Nutrient Balance
Highlights:
The nutrient balance will be updated and provided with an amended report later in 2024.
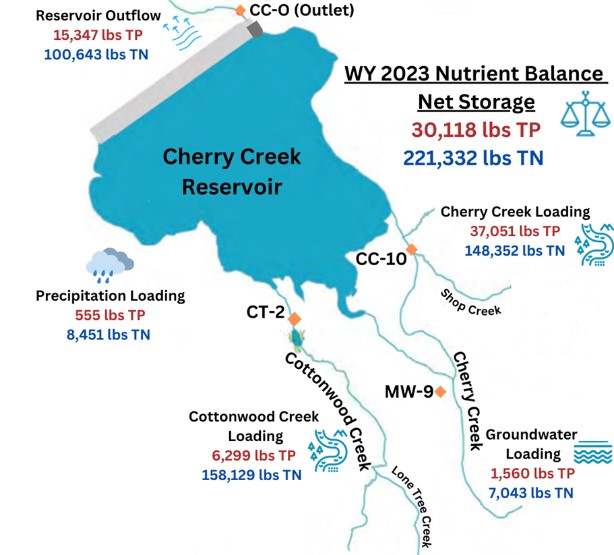
The nutrient concentrations of all inflows and the outflow of Cherry Creek Reservoir are used to calculate the mass storage on an annual basis. Phosphorus and nitrogen loading to the Reservoir results from surface water from Cherry and Cottonwood Creeks, precipitation and alluvial groundwater. The high flows from the major storm in May caused damage and inaccurate readings on equipment used to measure inflow so alternative calculations were used:
Inflow (USACE) - Precip (CCBWQA)- GW (CCBWQA) = Total surface water inflow
Total surface Inflows= Cottonwood Inflow CALC + Cherry Creek Inflow CALC
Used the 5 year relative contribution percentage to allocate to Cherry Creek (71%) and Cottonwood Creek (29%)
Ungauged flow = ΔStorage+ Outflows [Evap (USACE+USGS)] - Inflows
Ungauged flows were apportioned based on WY 2023 relative inflow contributions and concentrations of each source are multiplied by their relative inflow to determine loading.
Relative Percentage of Inflows into Cherry Creek Reservoir WY 2023
| Source |
Total Phosphorus |
Total Nitrogen | % of Total Inflow |
|---|---|---|---|
| Cherry Creek | 304 | 1226 ug/L | 66% |
| Cottonwood Creek | 25 | 637 ug/L | 26% |
| Alluvial Groundwater | 12 | 53 ug/L | 5% |
| Precipitation | 4 | 68 ug/L | 3% |
| Weighted Total | 351 | 1,963 ug/L | 100% |
Flow weighted nutrient concentrations are calculated based on relative flow and concentrations from samples collected at SW sites upstream of Cherry Creek Reservoir during base and storm flow conditions and long term medians for precipitation and groundwater.
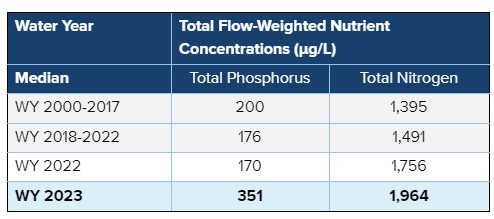
The flow-weighted influent phosphorus goal, derived as part of the 2009 Regulation 38 rulemaking process to achieve the 18 ug/L chlorophyll α standard is 200 µg/L. The increased precipitation significantly increased the surface water flow to Cherry Creek Reservoir and also allowed for more storm samples to be collected and analyzed in WY 2023 to characterize the change in water quality during high flow events. As a result, the WY 2023 flow-weighted TP concentration of 351 ug/L for all inflows is higher than recent years and historical medians. The WY 2023 flow-weighted TN inflow concentration of 1963 ug/L is also higher than recent years and historical medians.
Total Flow-Weighted Nutrient Concentrations Over Time
Useful Links
Nutrient Loading
Highlights:
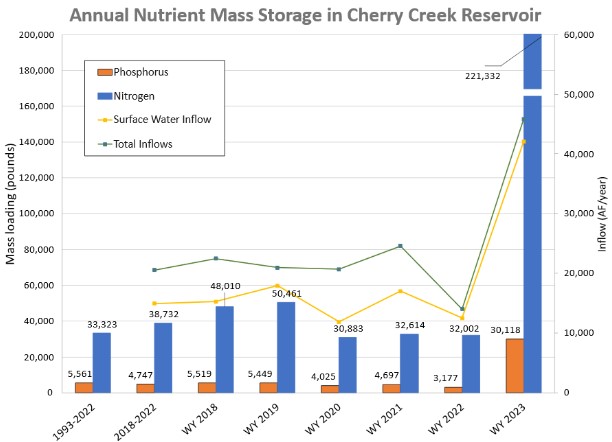
The nutrient storage in Cherry Creek Reservoir was approximately 6 times higher than the mean of the previous five years and recent historical values due to the significantly higher inflows and loading in WY 2023.
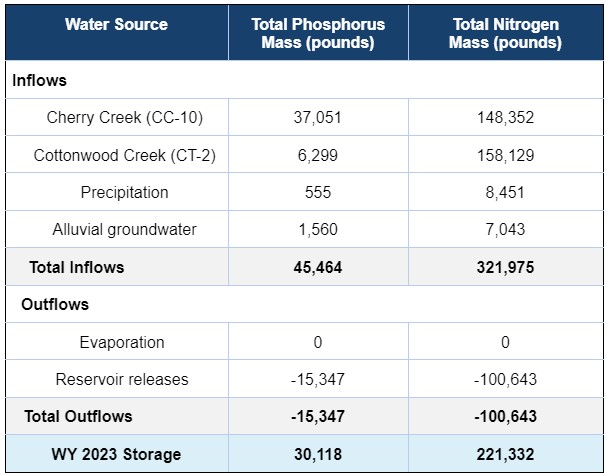
The nutrient loading calculations are used based on daily inflow from each source and the representative nutrient concentrations. The annual storage is based on a mass balance approach which is represented in the figure and table below.