
Precipitation
Highlights:
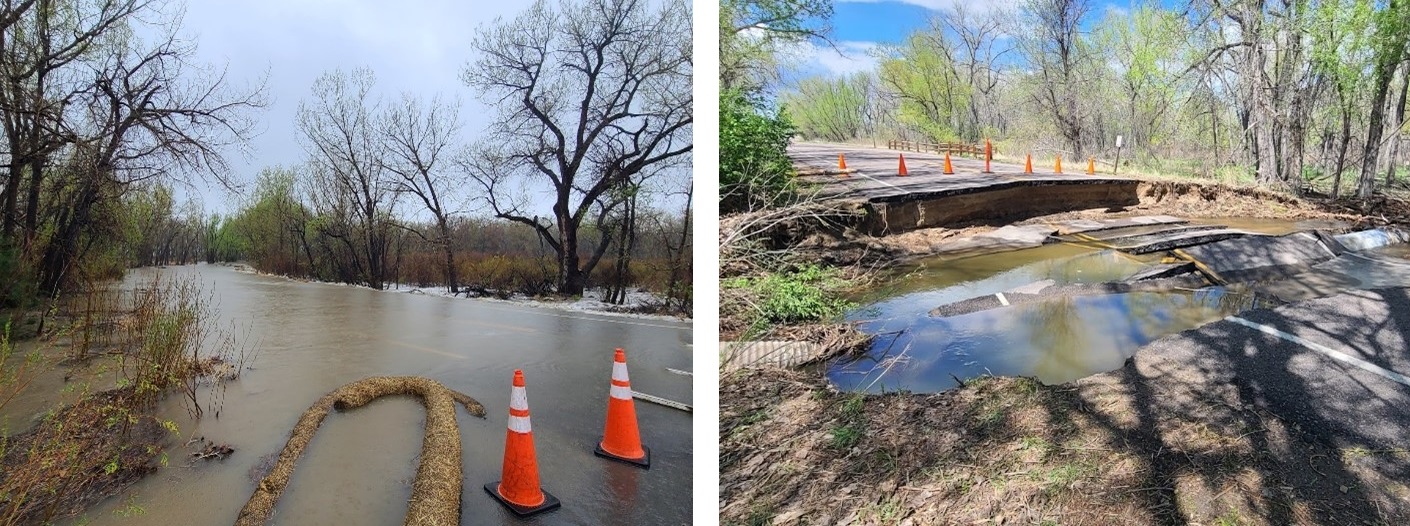
- Precipitation patterns are a factor in the Reservoir’s water quality due to impacts on inflows, water temperature, exchange rates, and overall Reservoir dynamics.
- The Cherry Creek Watershed received 172% of the average annual precipitation during WY 2023 with the 12-13” that fell during May and June contributing 60% of the whole year.
- Both the Cherry Ck MET Station/MHFD 10091 (CCSP) and the National Ocean and Atmospheric Administration (NOAA) at the Centennial Airport Station (KAPA) measured precipitation.
- The station in CCSP is used to measure precipitation on the Reservoir surface. Historical averages are based on KAPA values and the 30-year PRISM average (1991-2020).
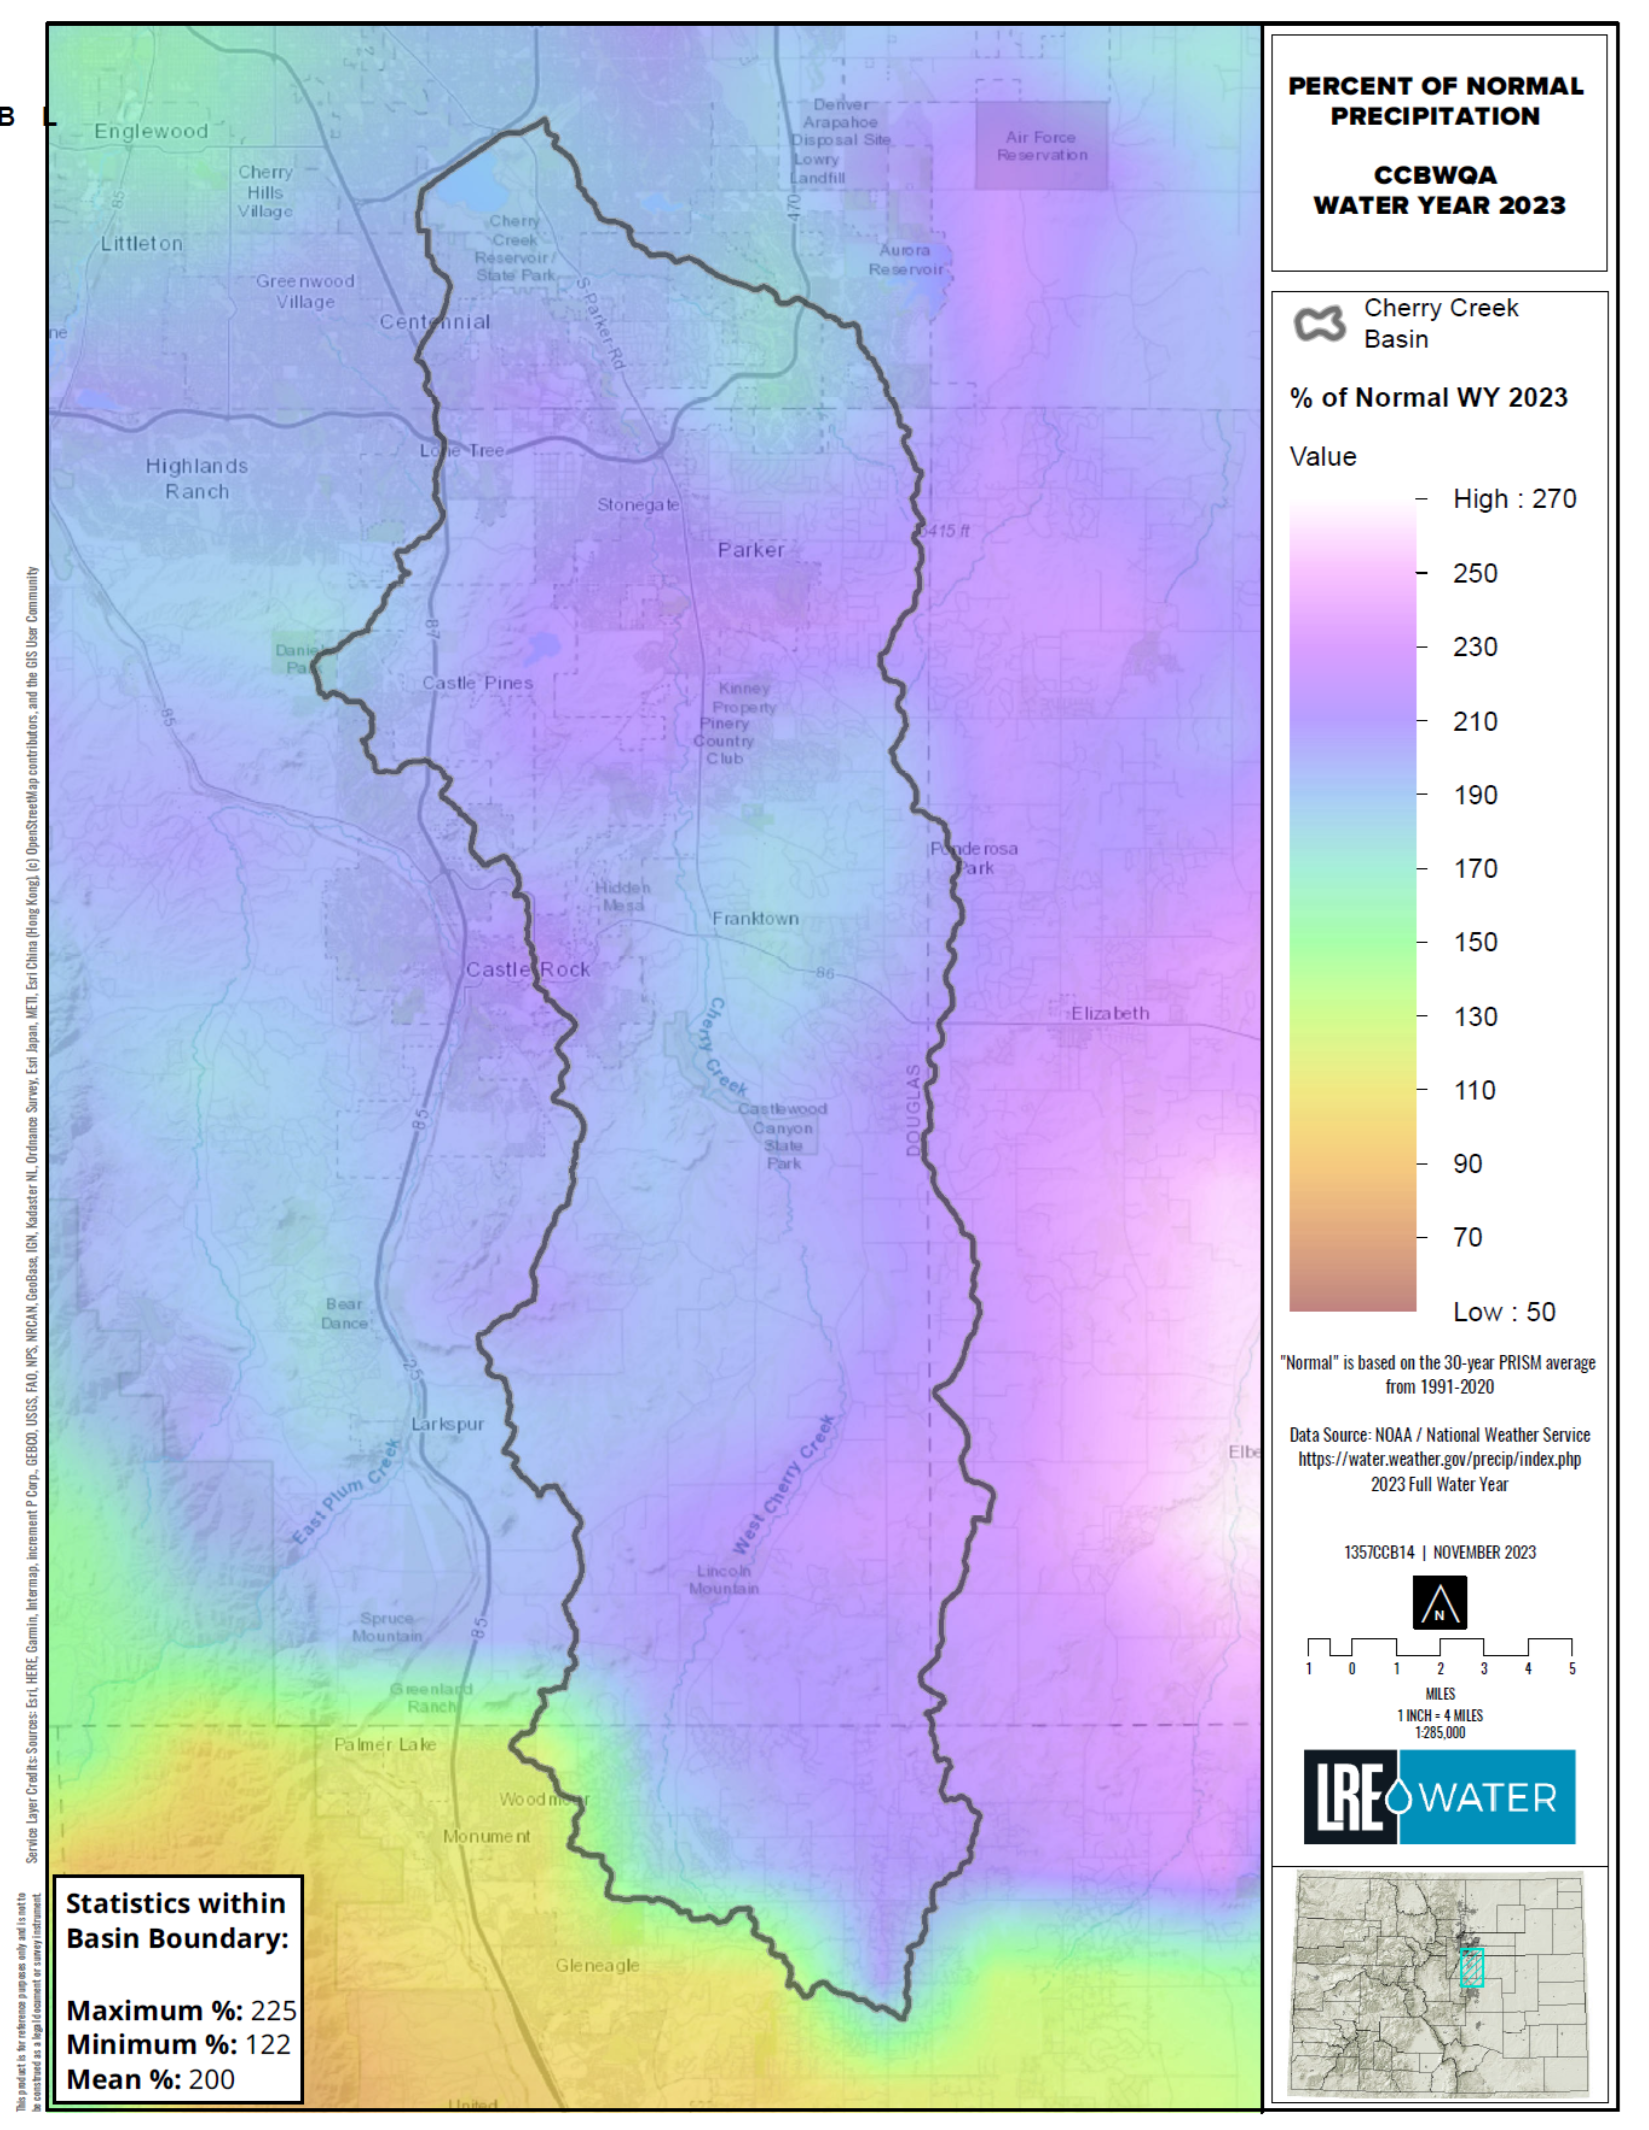
- The Cherry Creek watershed received an average of 200% of the 30-year PRISM average.
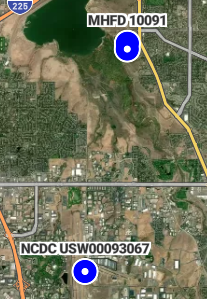
The CCSP MET Station (MHFD 10091) went online in June 2022. This local weather better captures localized precipitation impacts and was used for the Reservoir water balance in WY 2023. WY 2023 received 172% of the historical average at the National Ocean and Atmospheric Administration (NOAA) station at the Centennial Airport Station (KAPA) site and the watershed as a whole received 200% of the 30-year PRISM average.
Total WY 2023 precipitation at the KAPA station was over 3 inches higher than at the CCSP meteorological station. Total precipitation at the CCSP meteorological station was higher than the KAPA site in May but was lower in June, which helps demonstrate the spatial variability of storms in the watershed.
More weather station details, including weekly and monthly rolling averages and cumulative values for selected dates can be found on the CCBWQA Portal Precipitation Investigation Tool.
Precipitation also varied across the watershed and ranged from approximately 122% to 225% of the 30-year (1991-2020) PRISM average precipitation data generated by NOAA/National Weather Service. The watershed as a whole received approximately 200% of the 30-year average, while areas at the far south of the watershed received slightly less.
Percent of Normal Precipitation
Useful Links