Nutrient Depth Profiles
Highlights:
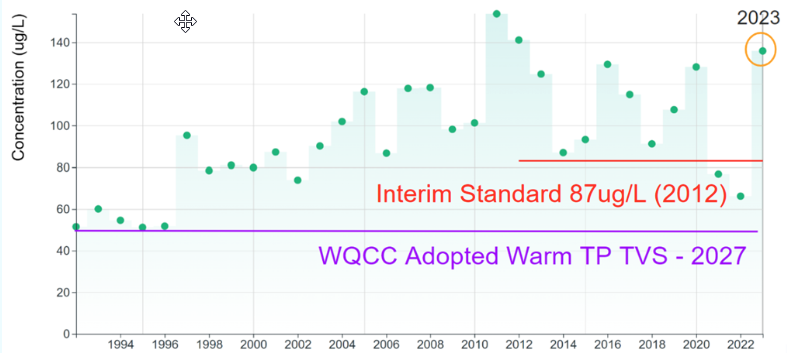
In WY 2023, the average seasonal (July- Sept) total phosphorus in the photic zone (top three meters of the Reservoir) was 135.9 ug/L, which is much higher than the long-term median of 92 ug/L, and the highest observed since 2011 and 2012.
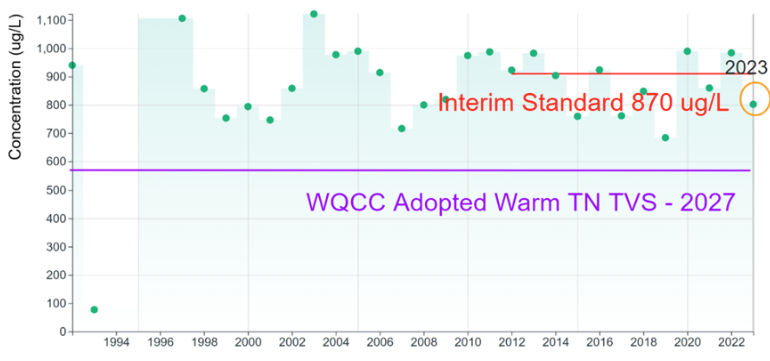
The average seasonal total nitrogen, 801.8 ug/L, was lower than the long-term median of 859 ug/L and below the 2012 interim criteria goal of 870 ug/L set in 2012.
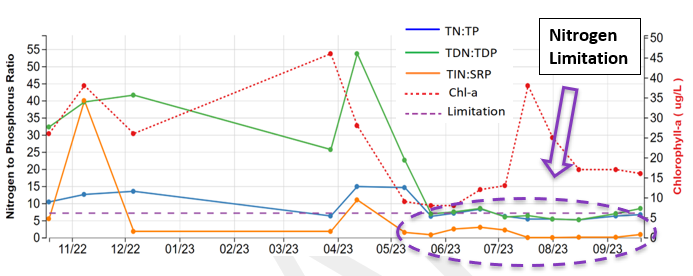
The bioavailable forms of nitrogen (nitrate, nitrite, and ammonia), were the limiting nutrients in the Reservoir for much of the year. Nitrogen-limited conditions give cyanobacteria a competitive advantage because they can fix nitrogen from the atmosphere. All forms of nitrogen were at or near limitation during the growing season in WY 2023.
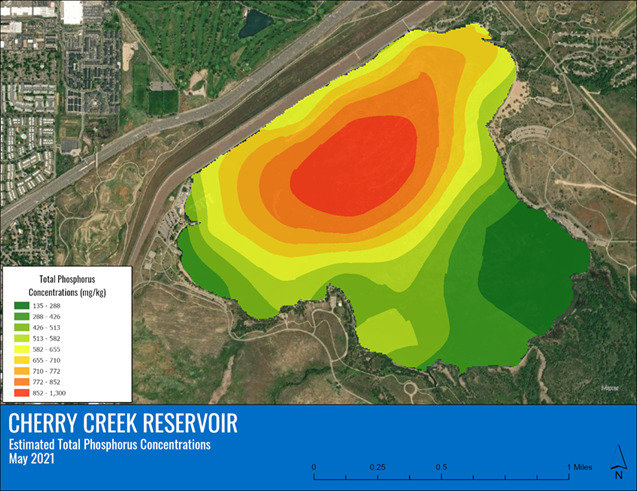
Total phosphorus (TP) concentrations generally increased with depth. TP concentrations were elevated in the hypolimnion (lower layer of water in a stratified lake) from early spring through summer. Phosphorus increases in the hypolimnion can be caused by internal loading or result from the decomposition of algal cells and other organic matter settling from higher levels in the water column. Inflows of cold runoff water, which have a higher density than warmer surface waters and sink to the bottom as they enter a lake, can also directly increase hypolimnetic nutrient concentrations, especially in reservoirs.
TP is made up of both particulate and dissolved phosphorus. Particulate phosphorus includes both inorganic material, such as soil particles and clay minerals, and organic phosphorus, which includes particulate forms such as algal cells and plant fragments. Total dissolved phosphorus includes dissolved organic and inorganic material. Dissolved inorganic phosphorus is usually reported as soluble reactive phosphorus, which represents the bioavailable form of phosphorus. Reactive or bioavailable forms of nutrients are readily available for uptake by algae or cyanobacteria and increases in these concentrations are likely to drive chlorophyll-ɑ production.
Nitrogen and phosphorus are the nutrients that limit algal growth in natural waters. However in nutrient-enriched lakes and reservoirs and during periods of nitrogen limitation, cyanobacteria populations have an advantage over other types of algae and can easily dominate populations and limit diversity. N:P ratios calculated during WY 2023 demonstrated that the bioavailable forms of nitrogen were frequently limited.
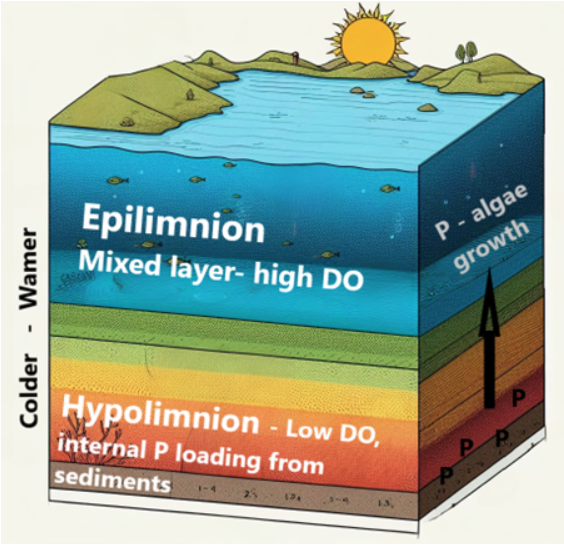
The epilimnion of a lake or reservoir is the mixed layer near the surface where the most phytoplankton algae reside because of its higher relative temperature and sunlight penetration for photosynthesis. The hypolimnion, or bottom layer, is cooler and denser and is where suspended materials settle to the bottom to decompose.
During bacterial decomposition, DO levels decline in the hypolimnion which lead to internal loading of phosphorus from the sediments. A recent study confirmed that the concentrations of phosphorus in the sediments of Cherry Creek Reservoir plays a significant role in internal phosphorus loading.
When the reservoir mixes, this phosphorus reaches the epilimnion where it can drive additional algae growth.
The Reservoir destratification system (RDS) at Cherry Creek Reservoir, which pumps air to the bottom of the Reservoir through diffusers, helps to mix the water column and is most effective in the spring and fall when there is less thermal stratification.
Useful Links
Nutrient Depth Profiles
info_outlineEach square on this depth profile represents a sampling event. The different square colors represent the magnitude of the the value for the a sampling event. To learn more about a specific data point, hover over a square with your mouse.
Seasonal Mean Concentration of Total Phosphorus Measured in Cherry Creek Reservoir
Seasonal Mean Concentration of Total Nitrogen Measured in Cherry Creek Reservoir
Hey! This page is interactive.
- Change the start and end dates to look at different time periods
- Investigate different parameters using the parameter dropdown list
- View different locations using the surface water location list
- To learn more about a specific data point, hover over a square with your mouse.