Field Measurements
Highlights:
The Reservoir met the aquatic life standards for temperature and pH in WY 2022.
The Reservoir did not meet the criteria for dissolved oxygen during one sampling event (August 24th, 2022) following a very large storm event.
The Reservoir met the temperature standards established for the Class I Warm Water Aquatic Life classification established by the Water Quality Control Commission (WQCC) in Regulation No. 31 (Reg 31) of 26.2 ˚C Maximum Weekly Average Temperature (MWAT) and 29.3 ˚C Daily Maximum (DM), as adopted in Regulation 38 for the Reservoir.
Regulation 31 states that in ”the upper portion of a lake or reservoir, dissolved oxygen shall not be less than 5.0 mg/L. There needs to be adequate refuge for aquatic with DO levels greater than 5.0 mg/L available at other depths or locations in the Reservoir at the same time period.” During WY 2022, DO met criteria at all depths during October through May. During June through September, low oxygen was present at lower depths, with upper depths meeting oxygen criteria, with the exception of the sampling event on August 24th, 2022 when the DO was below 5.0mg/L at all depths and monitoring locations in the Reservoir. These low dissolved oxygen concentrations followed a very large storm event in mid-August that resulted in over 1000 AF of water entering the Reservoir. Likely this high inflow of cooler water resulted in a mixing event of low DO concentrations from the bottom; reducing DO concentrations near the surface of the Reservoir.
Periods of low DO indicate high microbial activity or decomposition in the hypolimnion and sediments which reduces DO concentrations.
During WY 2022, the pH met the minimum and maximum standards of 6.5 and 9.0, based on the annual 15th and 85th percentiles. Higher pH values are usually correlated with higher productivity and elevated chlorophyll α in the reservoir.
Useful Links
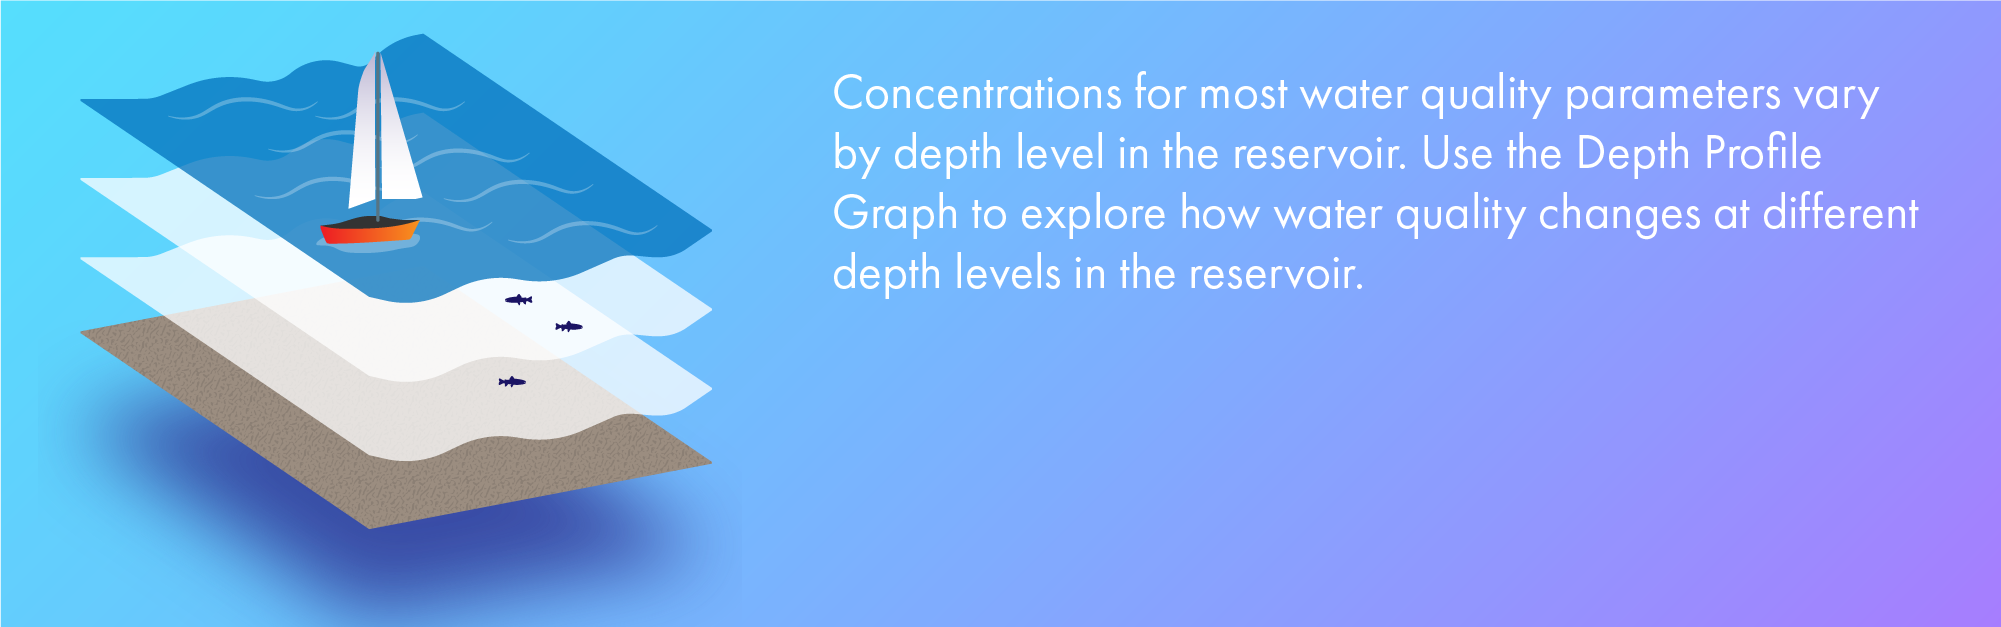
Reservoir Depth Profile: Temperature, Dissolved Oxygen, pH and Oxidation Reduction Potential
info_outlineEach square on this depth profile represents a sampling event. The different square colors represent the magnitude of the the value for the a sampling event. To learn more about a specific data point, hover over a square with your mouse.
Hey! This page is interactive.
- Change the start and end dates to look at different time periods
- Investigate different parameters using the parameter dropdown list
- View different locations using the surface water location list
- To learn more about a specific data point, hover over a square with your mouse.