USGS Stream Flows
Highlights:
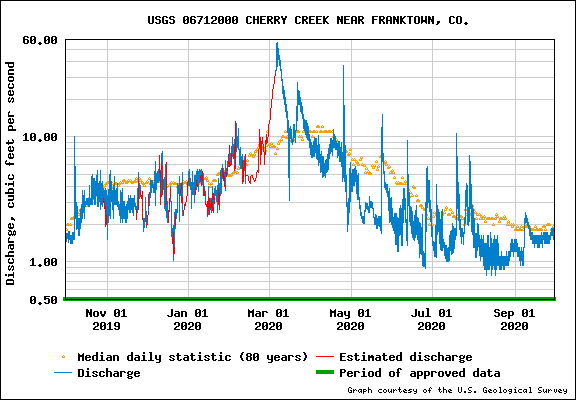
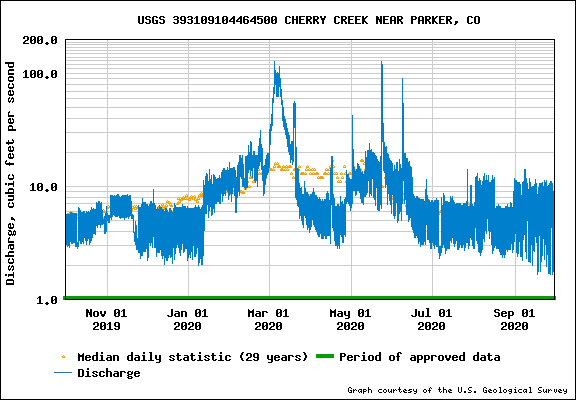
In WY 2020, flows measured at the USGS gage near Franktown (located near the center of the watershed) were 47% less than historical averages and flows at the USGS gage near Parker (located in the lower 1/3 of the watershed) were 11% below the historical average. Urbanization patterns are a factor in Cherry Creek Reservoir’s water quality and flows.
The yearly summary for the U.S. Geological Survey (USGS) gauge, Cherry Creek Near Franktown, CO, in the southern area of the watershed listed a total annual flow of 1,736 cfs (cubic feet per second) or 3640.8 Acre Feet (AF) with an annual daily mean of 4.74 cfs (9.97 AF) for WY 2020, which is approximately 53% of the annual mean discharge calculated from WY 1940-2020.
The yearly summary for the USGS gauge, Cherry Creek Near Parker, CO, listed a provisional total annual flow of 3,678 cfs (7293.5 AF) and an annual daily mean of 10 cfs (19.83 AF), which is approximately 89% of the annual mean discharge calculated from WY 1992-2020.
It is noteworthy that the headwater flows of Cherry Creek in Castlewood Canyon were 47% lower than average, but flows were only 11% below average by the time the stream reached the USGS gauge, Cherry Creek, Near Parker, CO. However, the period of record for the Franktown site is much longer than the Parker site which may be responsible for the difference.
Useful Links
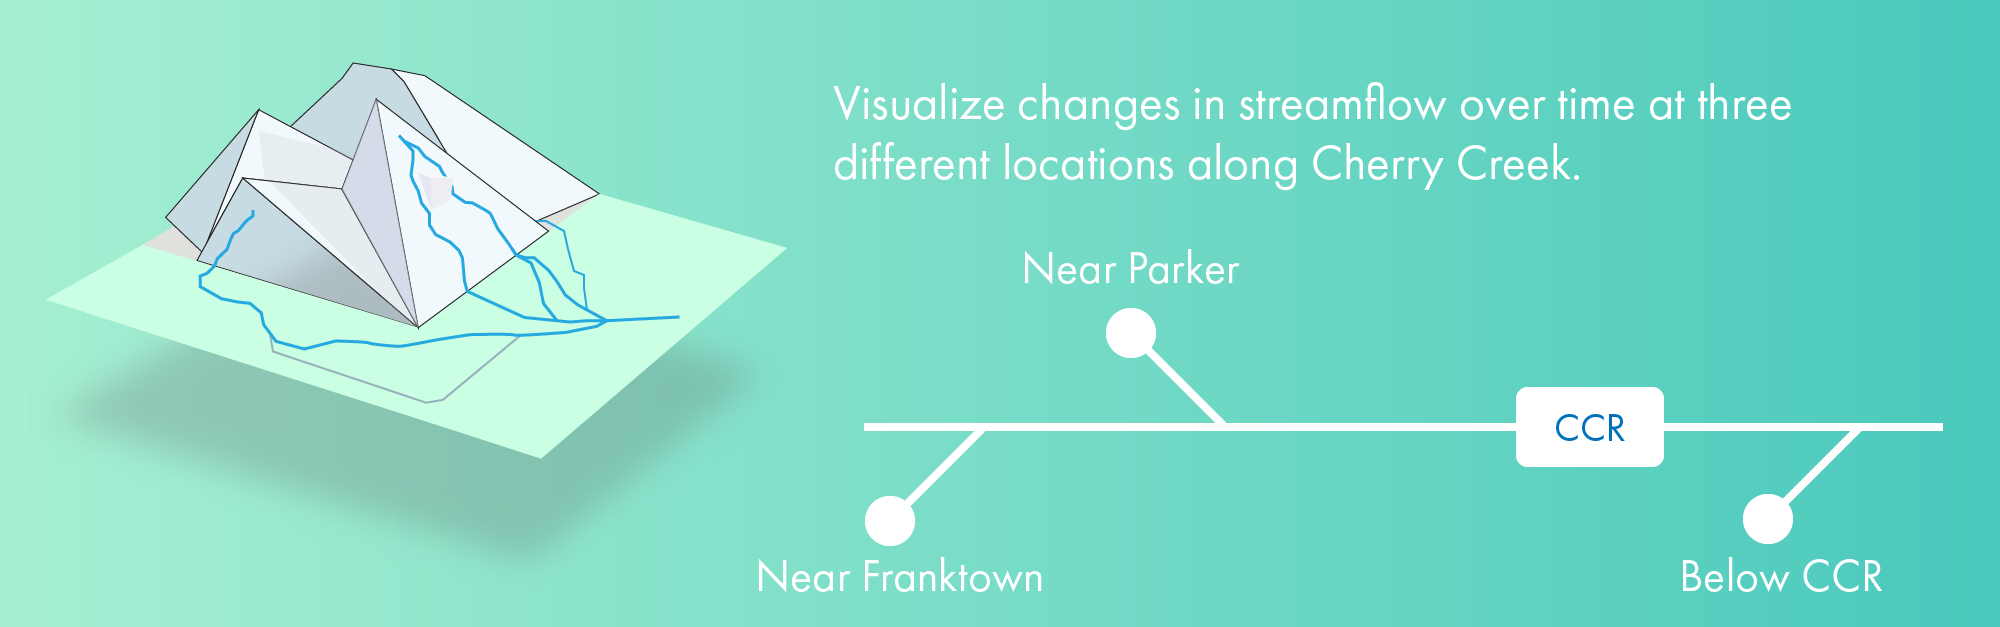
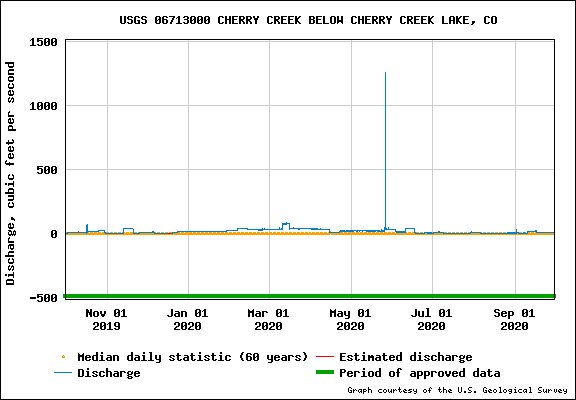
Visualize streamflow over time at three different sites along Cherry Creek.
The sites are ordered from most upstream to most downstream.