Surface Water Inflow Concentrations
Highlights:
In WY2020, Total phosphorus concentrations in both Cherry Creek and Cottonwood Creek were lower than the 2011-2019 average. Phosphorus concentrations in Cottonwood Creek are 70% lower than concentrations in Cherry Creek.
In WY2020, Total nitrogen concentrations in both Cherry Creek and Cottonwood Creek were higher than the 2011-2019 average. Nitrogen concentrations in Cherry Creek are 40% lower than concentrations in Cottonwood Creek.
Influent Summary Concentrations - Total Nitrogen
| Water Year | Cherry Creek | Cottonwood Creek |
|---|---|---|
| WY 2011-2019 | 1,336 ug/l | 1,800 ug/l |
| WY 2018 | 1,646 ug/l | 1,984 ug/l |
| WY 2019 | 1,565 ug/l | 2,427 ug/l |
| WY 2020 | 1,013 ug/l | 345 ug/l |
Influent Summary Concentrations - Total Phosphorus
| Water Year | Cherry Creek | Cottonwood Creek |
|---|---|---|
| WY 2011-2019 | 250 ug/l | 72 ug/l |
| WY 2018 | 212 ug/l | 78 ug/l |
| WY 2019 | 222 ug/l | 49 ug/l |
| WY 2020 | 127 ug/l | 7.4 ug/l |
Cherry Creek flows from south to north to the Reservoir through a 245,000-acre drainage basin. The basin includes various types of land use, including both agriculture and heavy development, as well as permitted discharges in and around Cherry Creek. Cottonwood Creek is the other major surface water input to Cherry Creek Reservoir. Land in the Cottonwood Creek watershed is more urbanized than the Cherry Creek watershed.
For more annual comparisons visit the WQ Update WQ Inflow Comparison Page.
Useful Links
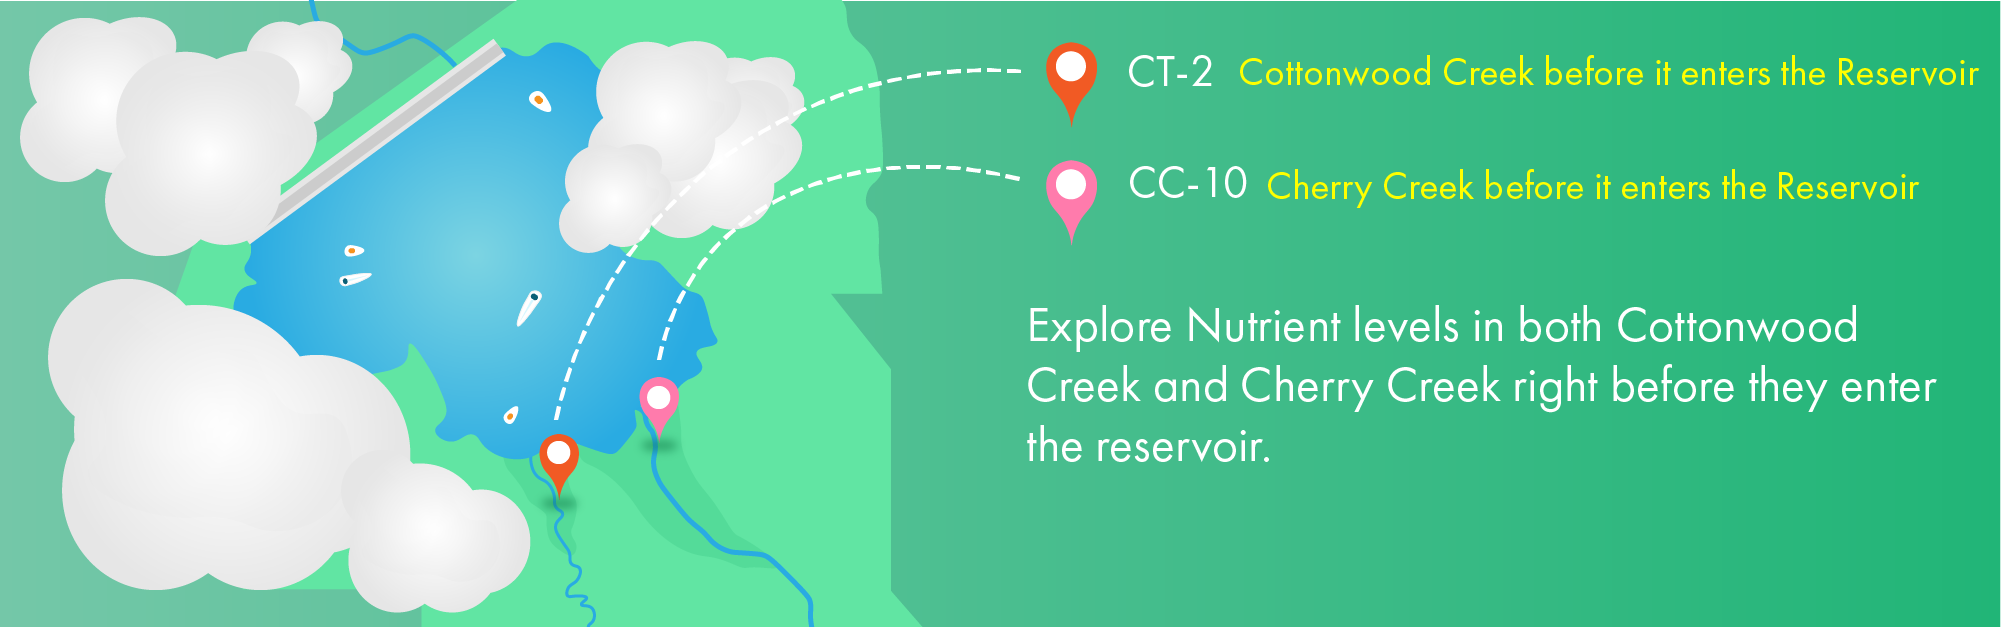
Phosphorus Concentrations, CC-10 and CT-2
info_outlineEach point on this graph represents a sampling event. The different point colors represent different locations, while the filled and hollow icons indicate whether the parameter is total or dissolved. To learn more about a specific data point, hover over it with your mouse.
Nitrogen Concentrations, CC-10 and CT-2
info_outlineEach point on this graph represents a sampling event. The different point colors represent different locations, while the filled and hollow icons indicate whether the parameter is total or dissolved. To learn more about a specific data point, hover over it with your mouse.
Total Suspended Solids (TSS) Concentrations, CC-10 and CT-2
info_outlineEach point on this graph represents a sampling event. The different point colors represent different locations, while the filled and hollow icons indicate whether the parameter is total or dissolved. To learn more about a specific data point, hover over it with your mouse.
Hey! This page is interactive.
- Change the start and end dates to change the dates on the graph
- To learn more about a specific data point, hover over it with your mouse.