Surface Water Inflow Concentrations
Highlights:
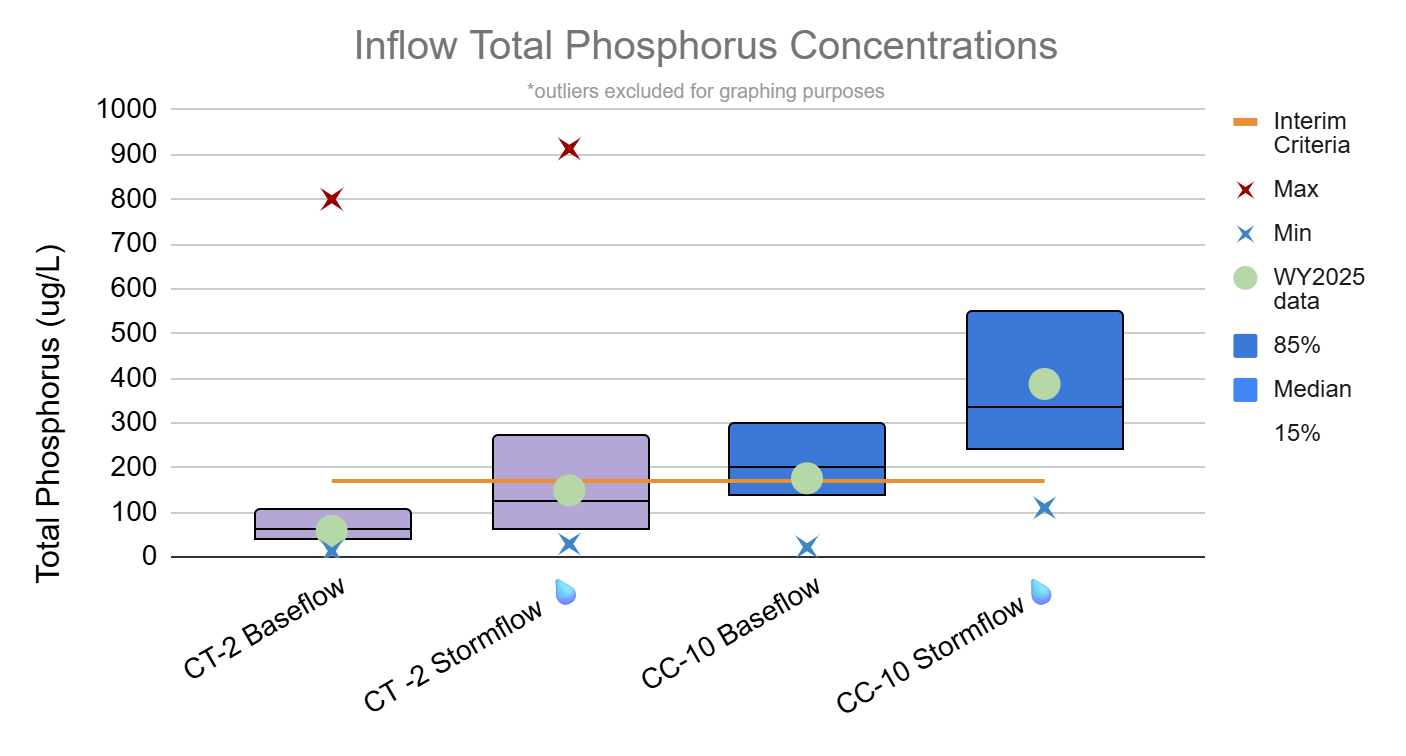
In WY 2025, total phosphorus (TP) concentrations in both Cherry Creek and Cottonwood Creek were slightly below the baseline median during base flow but slightly above baseline during storm flow conditions.
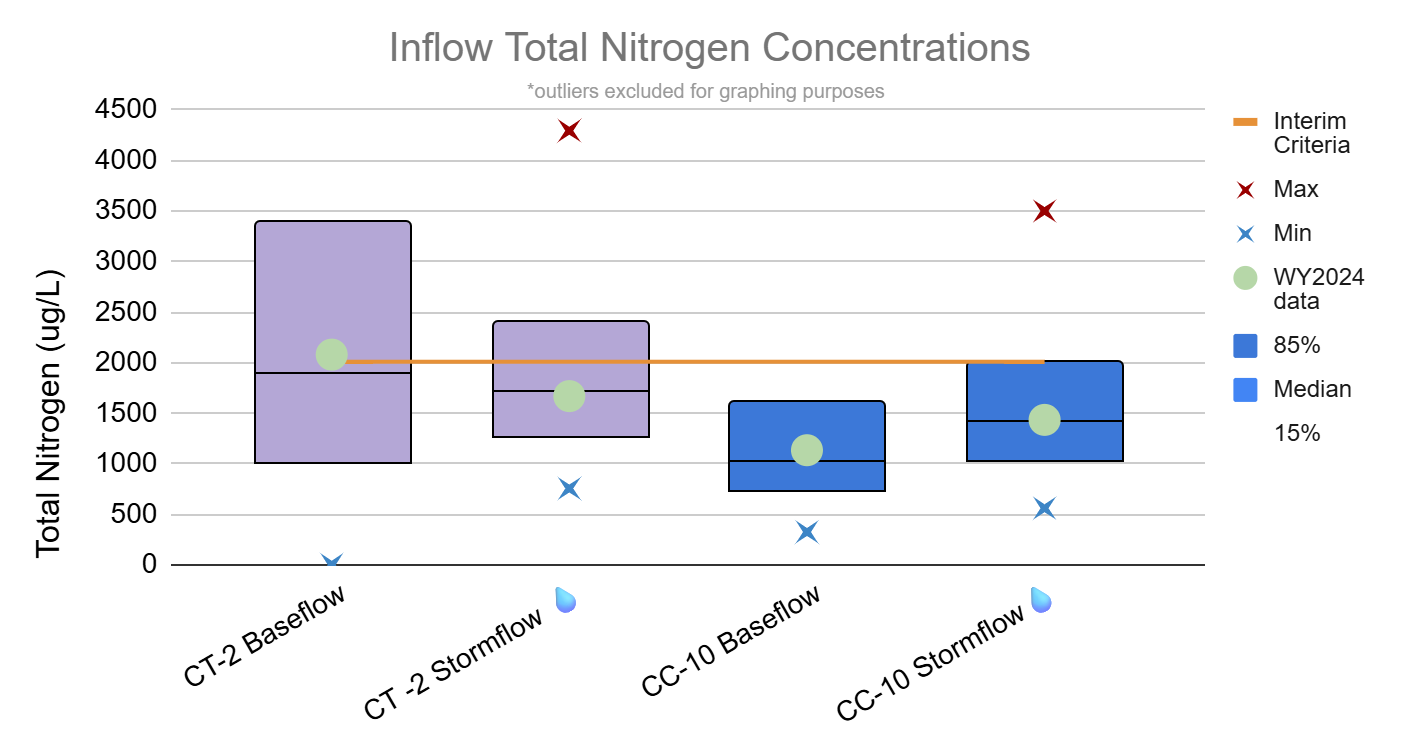
In WY 2025, median total nitrogen (TN) concentrations in both Cherry Creek and Cottonwood Creek were slightly higher than the baseline median for base flow and storm flow conditions. TN concentrations were approximately 50% lower in Cherry Creek than Cottonwood Creek in baseflow samples analyzed.
Cherry Creek flows from south to north to the Reservoir through a 245,000-acre drainage basin. The basin includes various types of land use, including both undeveloped and urbanized areas, with the urbanized areas located closer to the Reservoir. Cottonwood Creek is the other major surface water input to Cherry Creek Reservoir. Overall, land in the smaller Cottonwood Creek watershed is more fully developed than the Cherry Creek watershed, which extends above the El Paso County line. Both creeks receive permitted discharges from wastewater treatment facilities.
For more annual comparisons visit the WQ Update WQ Inflow Comparison Page.
Useful Links

Hey! This page is interactive.
- Change the start and end dates to change the dates on the graph
- To learn more about a specific data point, hover over it with your mouse.