Special Studies
Highlights:
In 2025, CCBWQA completed and embarked on several special projects/studies to better understand conditions in the watershed and opportunities to reduce pollutant loading to the reservoir.
Special projects and studies included:
- Watershed Plan Update: In 2025, CCBWQA updated its 2012 Watershed Plan. The updated plan incorporates findings from watershed and reservoir modeling recently completed by the CCBWQA and provides direction for future watershed actions to improve and protect Cherry Creek Reservoir. During 2023-2025, CCBWQA held four planning workshops to incorporate feedback from the Board and Technical Advisory Committee (TAC). The Cherry Creek Reservoir Watershed Plan is a strategic plan to improve water quality in the reservoir and its tributary watershed.
- APWA Award: In 2025, the American Public Works Association (APWA) recognized two Cherry Creek basin projects with awards. The first was the Dove Creek Regional Pond project, which was co-sponsored by SEMSWA, MHFD, and CCBWQA. The project provided rehabilitation and retrofitting of the Dove Creek channel and regional water quality facility. The second project was the Race for the Watershed led by SEMSWA, which raised money for Colorado Association of Stormwater and Floodplain Association scholarships. Many friends of CCBWQA joined the 5K fun run in Cherry Creek State Park.
- Special Projects Planning: As part of the Watershed Plan update, CCBWQA prioritized several special studies for 2026 to improve understanding of nutrient-related issues in the watershed. These projects include: planning for a more in-depth review of in-reservoir management strategies; phase 2 of the receiving pervious area study to explore performance enhancements for grass swales; performance monitoring opportunities for detention basin retrofits; and developing a methodology to assess the “stormwater quality level of service” for existing developed areas, as a few examples.
Useful Links
Watershed Plan Relative Source Contributions
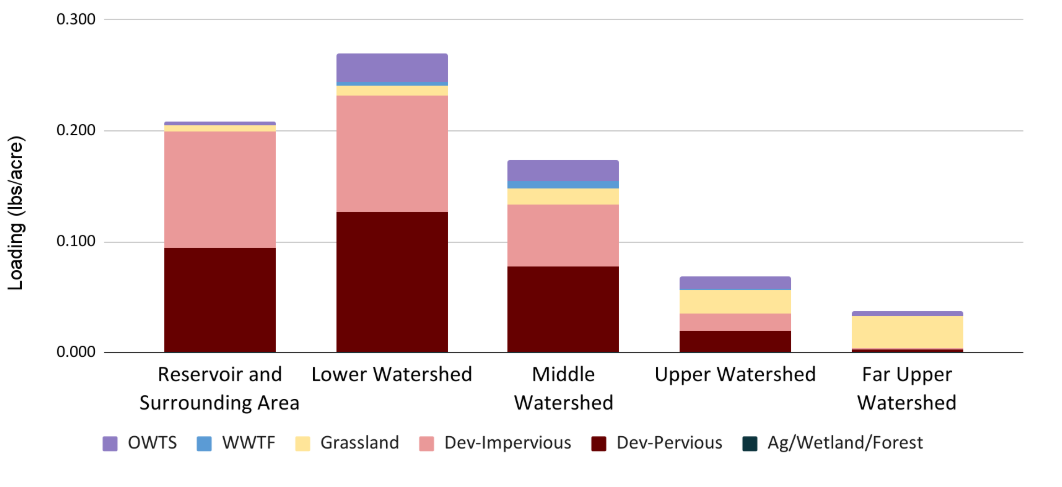
The Watershed Plan leverages monitoring and modeling results to target high impact locations and project types.
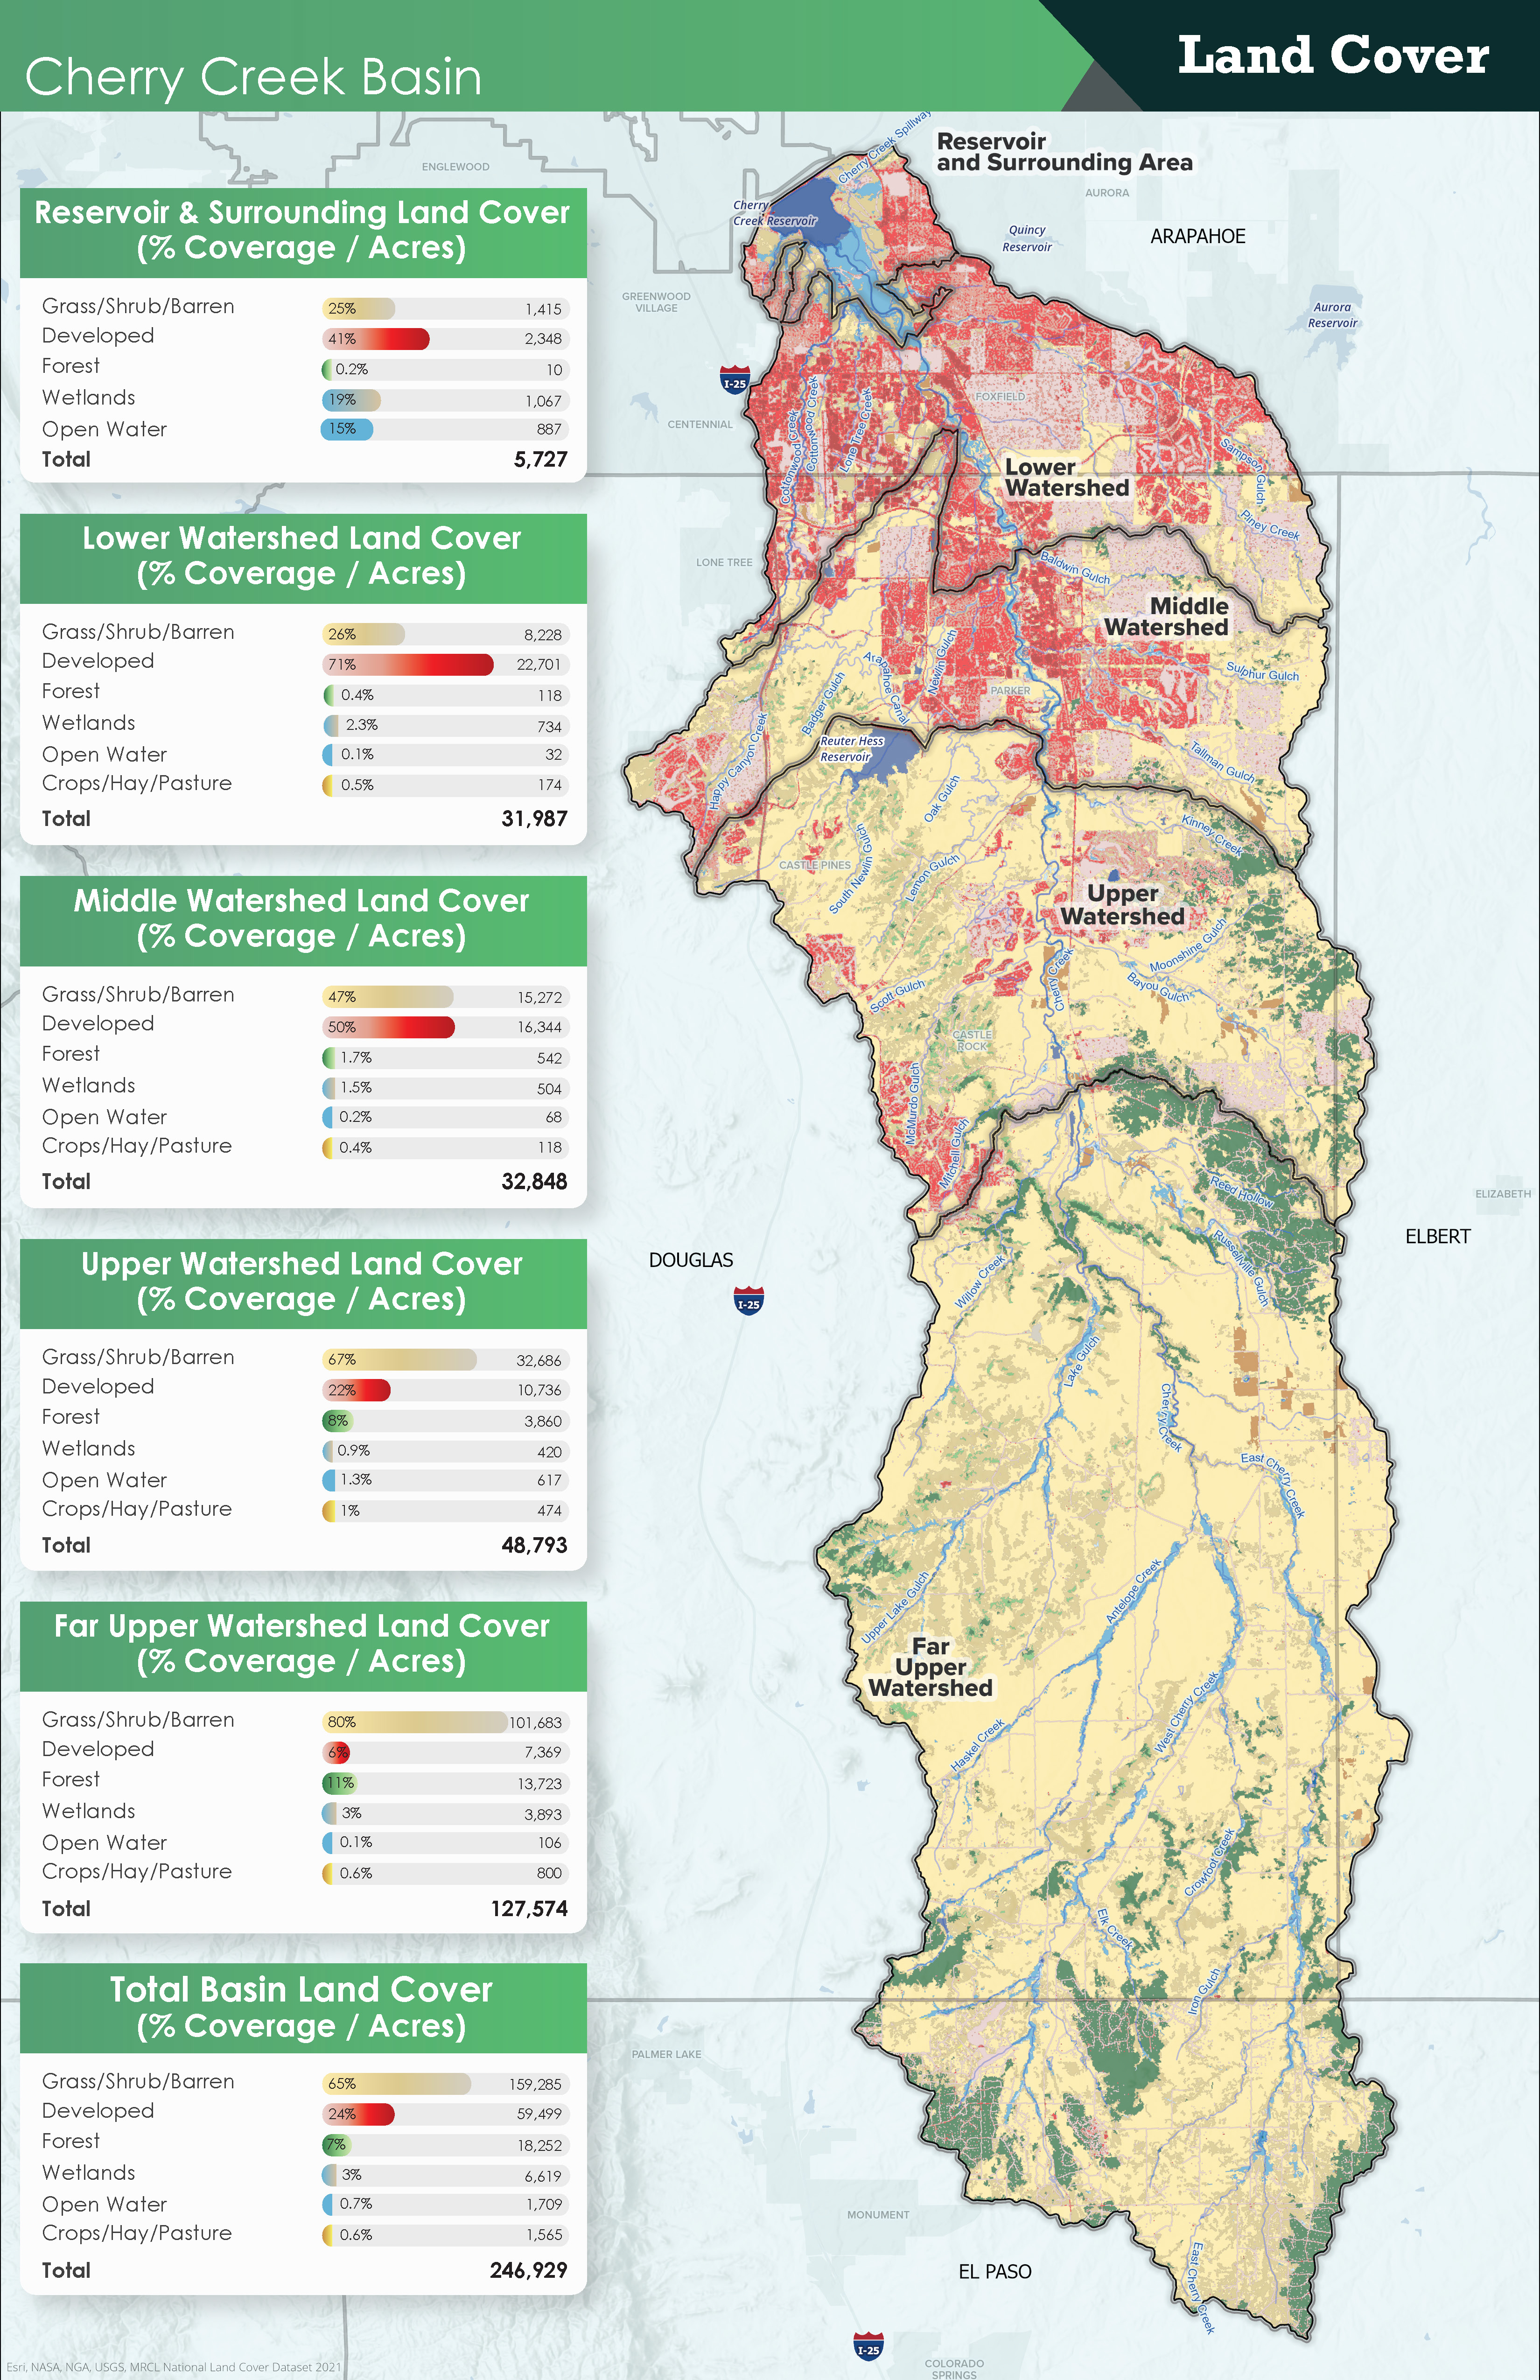
Click to see larger version of map
CCBWQA applied modeling results broken out by subbasins to examine where and what sources contribute the most to nutrient loading. For example, the graph below illustrates how Developed areas have the highest phosphorus source contributions per acre, especially in the Reservoir area, low and middle watershed. Grasslands are a more dominant source upstream in the watershed, but have low loading rates over all. Onsite water treatment systems (OWTS) increase upstream but have low loading. Waste water treatment facilities (WWTF) contribute a very small percentage and Agriculture, Forest and Wetlands impacts are negligible.