Stream Flows
Highlights:
In WY 2025, flows measured at the USGS gage near Franktown (located near the center of the watershed) were 62% of the 33-year (1992-2024) historical average and flows at the USGS gage near Parker (located in the lower third of the watershed) were 144% of the 33-year average which demonstrates the impacts of urban development and runoff on streamflow.
Cherry Creek near Franktown WY 2025 Statistics:
Drainage Area: 169 square miles
Total Annual Flow: 3,987 AF
Annual Daily Mean Flow Rate: 5.5 cfs (10.9 AF/day)
Percent of 33-year (1992-2024) Average Discharge: 73%
USGS Gage: Cherry Creek near Parker WY 2025 Statistics:
Drainage Area: 287 square miles
Total Annual Flow: 12,198 AF
Annual Daily Mean Flow Rate: 16.8 cfs (33.3 AF/day)
Percent of 33-year (1992-2024) Average Discharge: 146%
While results from a single water year are often insufficient to support robust statistical analysis, annual calculations are included for reference. The analysis uses the PRF Statistics Tool available through the data portal to evaluate the statistical significance of upstream and downstream changes at PRFs during WY 2025. No statistically significant trends were observed across the Cottonwood Treatment Train as a whole during WY 2025. Additionally, limited stormflow sampling during the year likely reduced the ability to detect patterns that are typically observed under higher-flow conditions.
Useful Links
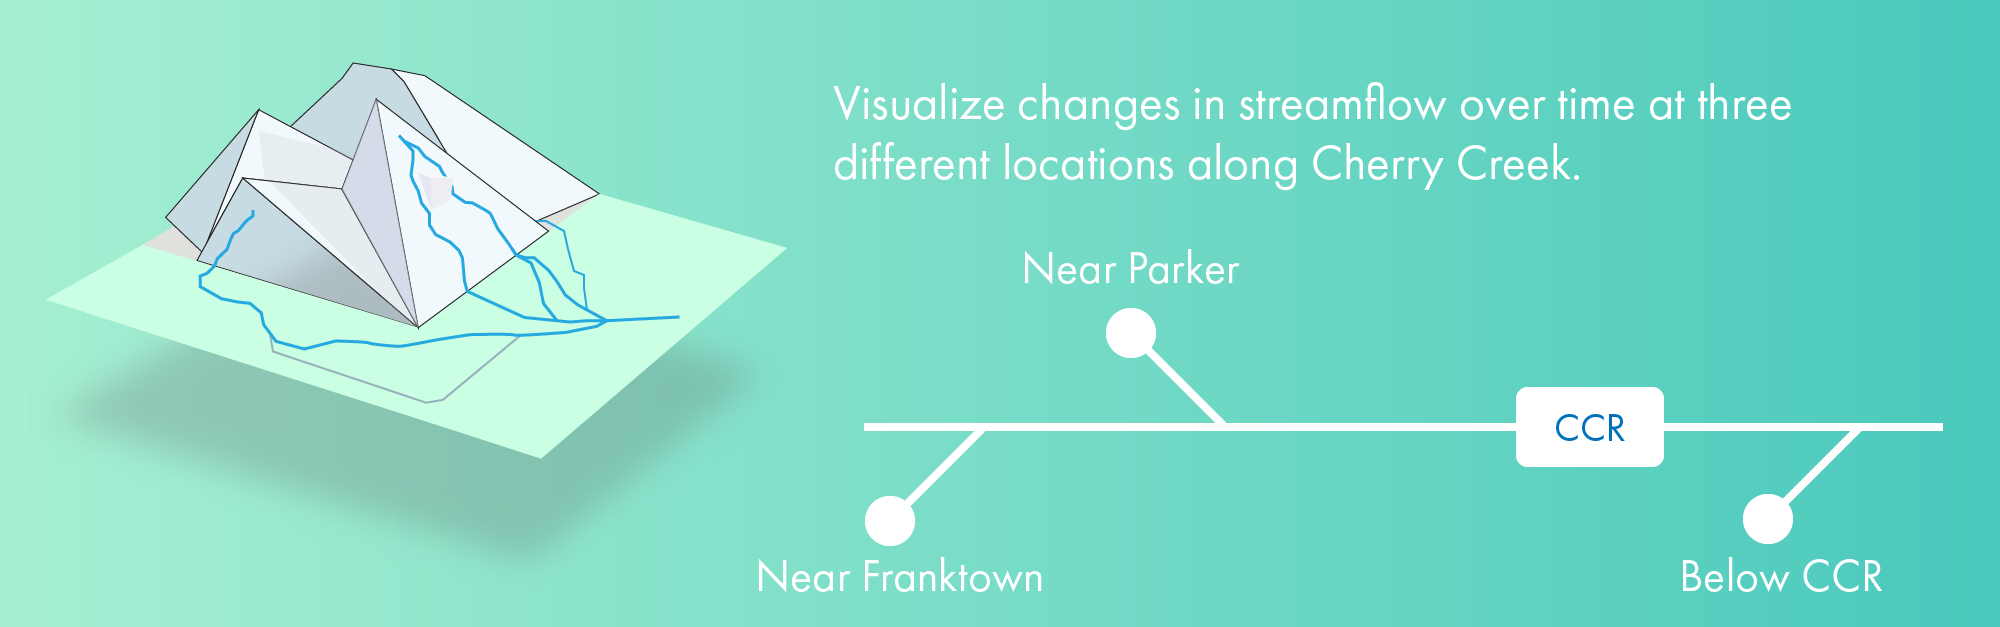
Visualize streamflow over time at three different sites along Cherry Creek.
The sites are ordered from most upstream to most downstream.