Stream Flows
Highlights:
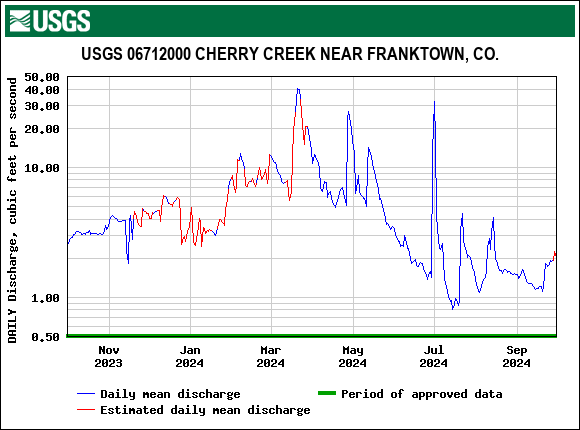
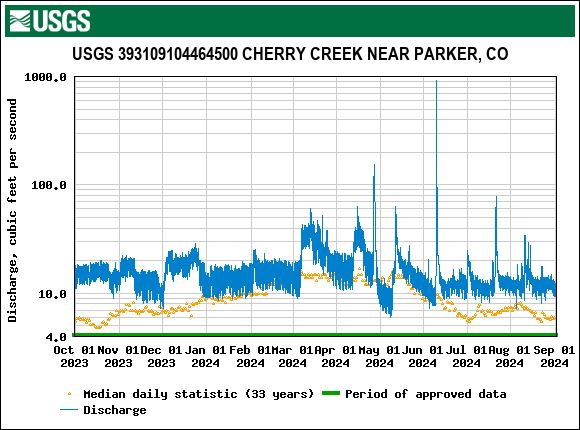
In WY 2024, flows measured at the USGS gage near Franktown (located near the center of the watershed) were 62% of the 33-year (1992-2024) historical average and flows at the USGS gage near Parker (located in the lower third of the watershed) were 144% of the 33-year average which demonstrates the impacts of urban development and runoff on streamflow.
Cherry Creek near Franktown WY 2024 Statistics:
Drainage Area: 169 square miles
Total Annual Flow: 3987 AF
Annual Daily Mean Flow Rate: 5.5 cfs (10.9 AF/day)
Percent of 31-year (1992-2023) Average Discharge: 73%
USGS Gage: Cherry Creek near Parker WY 2024 Statistics:
Drainage Area: 287 square miles
Total Annual Flow: 12,198 AF
Annual Daily Mean Flow Rate: 16.8 cfs (33.3 AF/day)
Percent of 31-year (1992-2023) Average Discharge: 146%
Useful Links
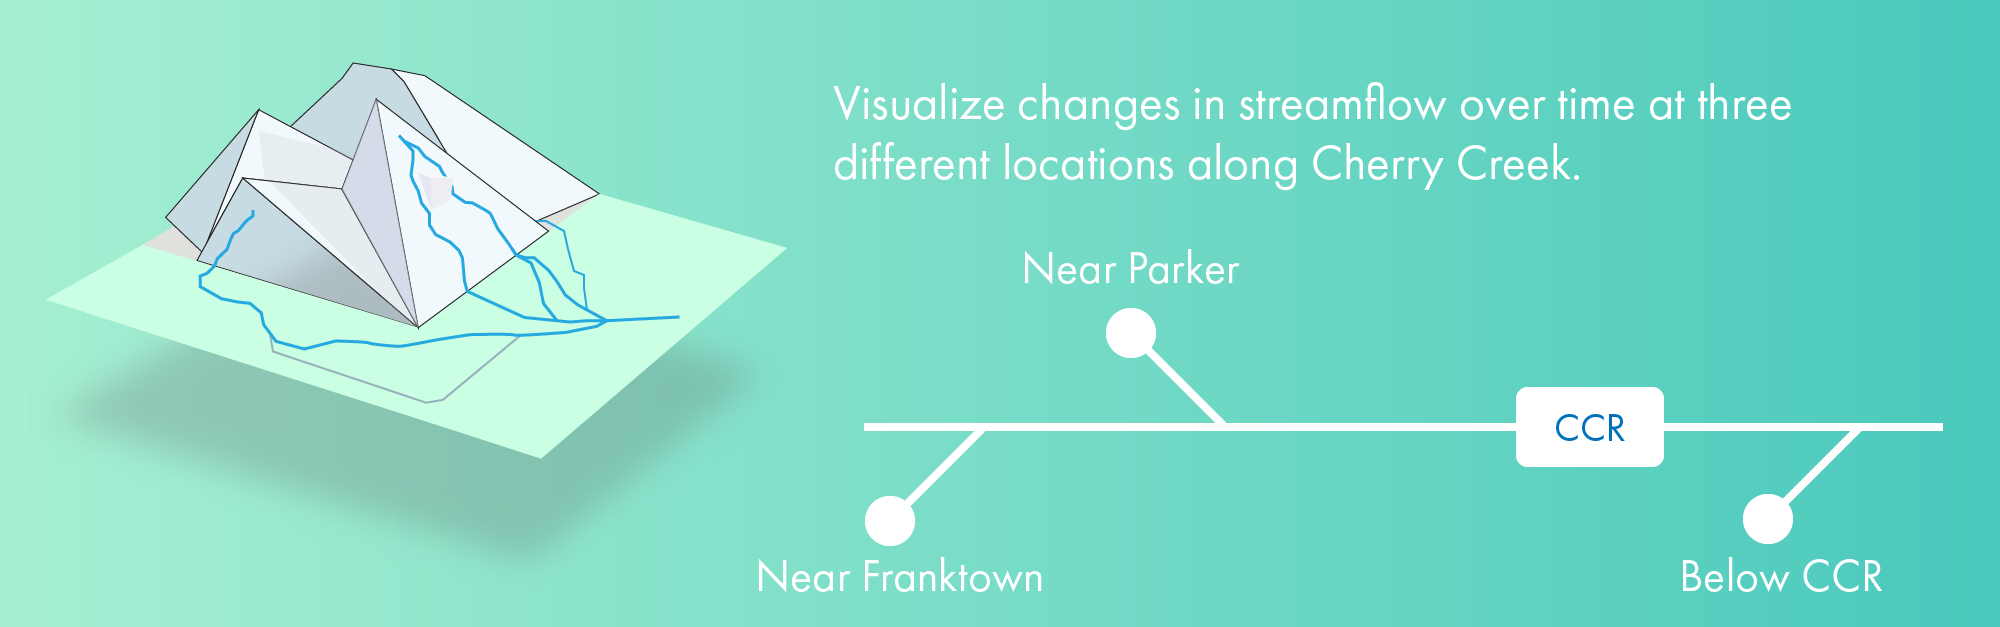
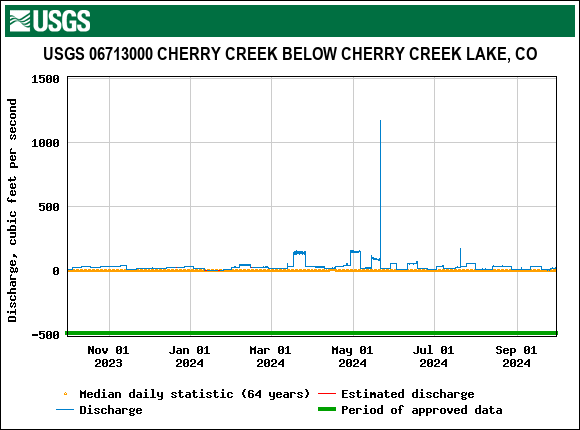
Visualize streamflow over time at three different sites along Cherry Creek.
The sites are ordered from most upstream to most downstream.