CCR Nutrient Balance
Highlights:
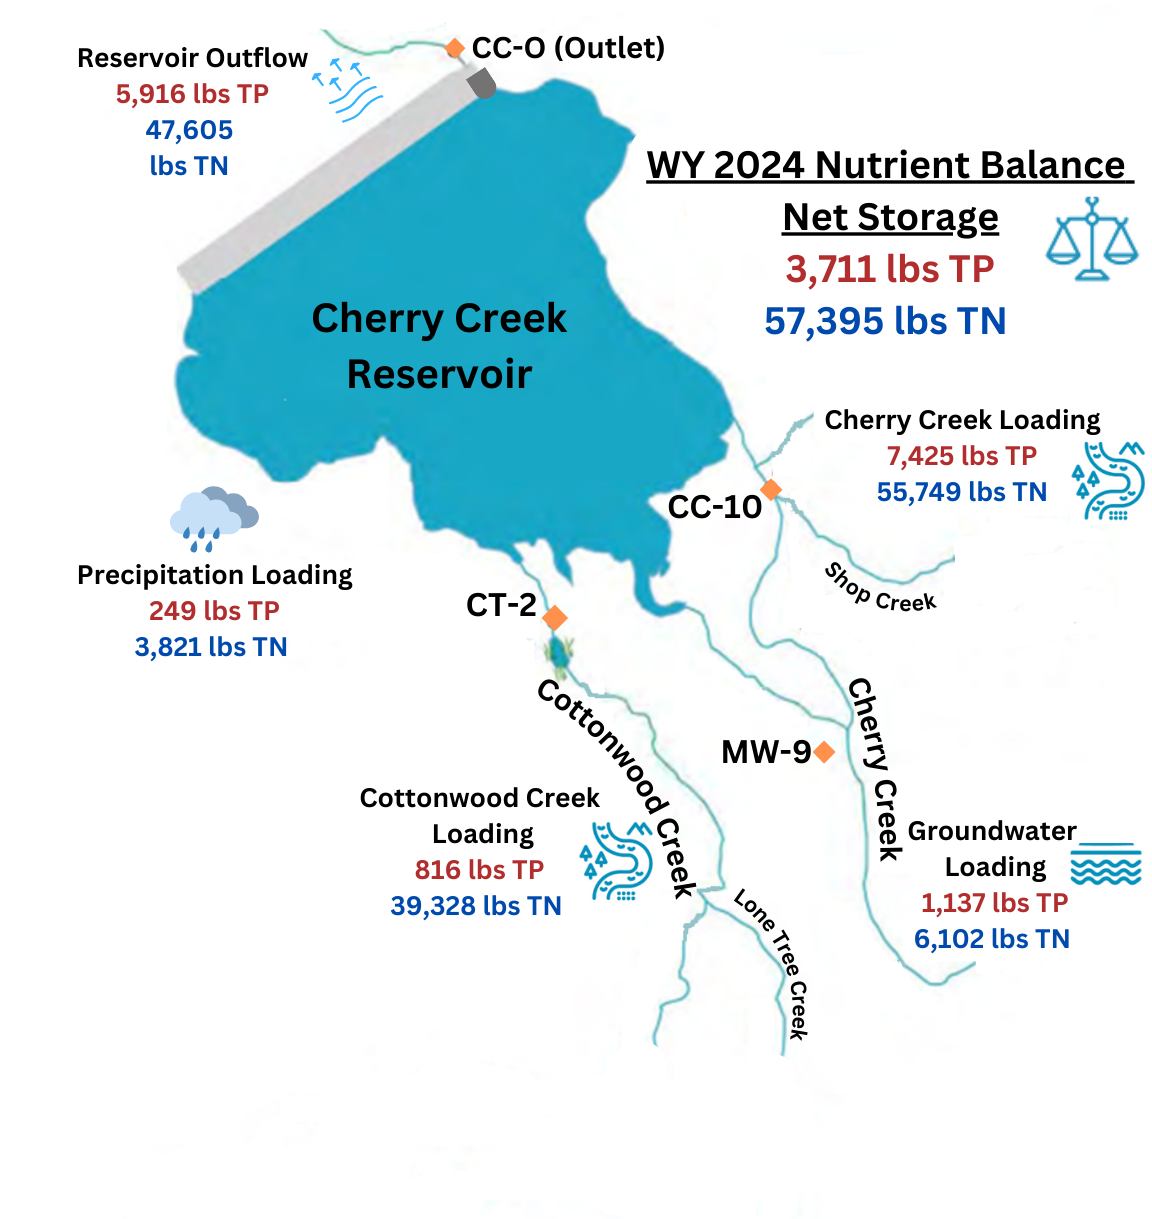
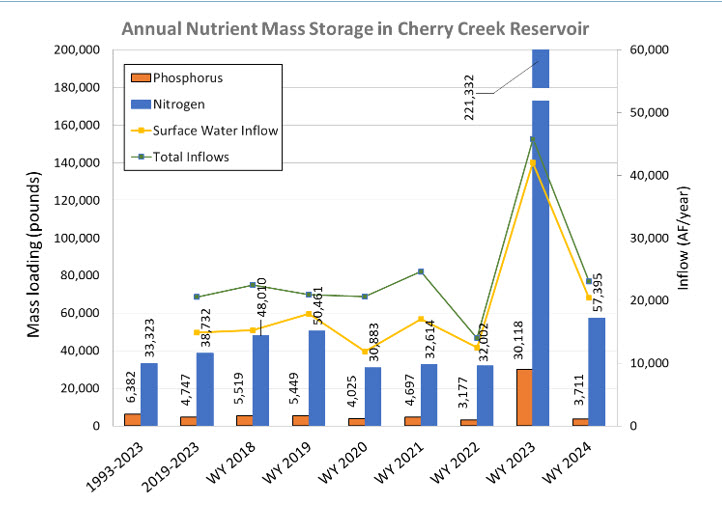
In WY 2024 phosphorus and nitrogen in the Reservoir increased by approximately 3,200 and 57,000 pounds, respectively, similar to previous Water Years and significantly less than than the high precipitation WY 2023.
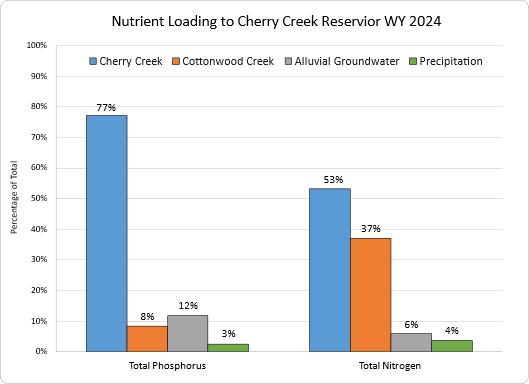
The differences in flow and nutrient concentrations between Cherry Creek and Cottonwood Creek are apparent when evaluating the relative nutrient loading from each source. Cherry Creek contributed 77% of the phosphorus and 53% of the nitrogen loading to the Reservoir in WY 2024. In comparison, Cottonwood Creek was responsible for 8% of the phosphorus but 37% of the nitrogen.
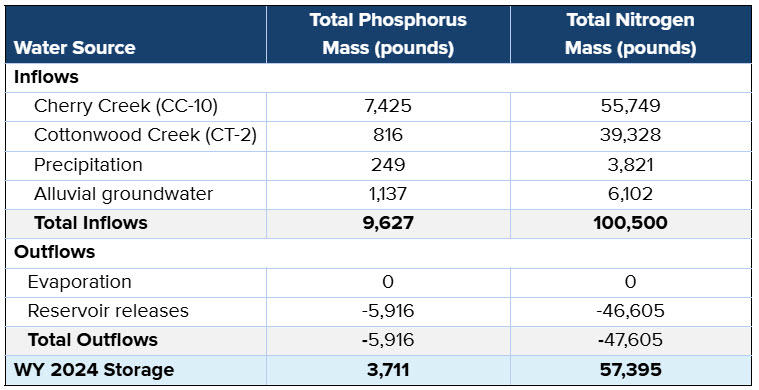
The nutrient concentrations of all inflows and the outflow of Cherry Creek Reservoir are used to calculate the mass storage on an annual basis. Phosphorus and nitrogen loading to the Reservoir results from surface water from Cherry and Cottonwood Creeks, precipitation and alluvial groundwater. The concentrations and inflows of each source are used to determine loading.
Relative Percentage of Inflows into Cherry Creek Reservoir WY 2024
| Source |
Total Phosphorus (ug/L) |
Total Nitrogen (ug/L) | % of Total Inflow |
|---|---|---|---|
| Cherry Creek | 115 | 863 | 62% |
| Cottonwood Creek | 13 | 609 | 26% |
| Alluvial Groundwater | 18 | 96 | 9% |
| Precipitation | 4 | 60 | 3% |
| Weighted Total | 149 | 1,626 | 100% |
Flow weighted nutrient concentrations are calculated based on relative flow and concentrations from samples collected at surface water sites upstream of Cherry Creek Reservoir during base and storm flow conditions and long term medians for precipitation and groundwater.
The flow-weighted influent phosphorus goal, derived as part of the 2009 Regulation 38 rulemaking process to achieve the 18 ug/L chlorophyll α standard is 200 µg/L. The flow-weighted TP concentration for all inflows (149 µg/L) and TN concentration (1,626 µg/L) in WY 2024 were approximately half of the values recorded in WY 2023 and lower than the 5-year and historical averages. Following the high flow events and multiple storms in WY 2023 which resulted in high concentrations, the WY 2024 flow weighted nutrient concentrations were in line with those of a more average year.
Total Flow-Weighted Nutrient Concentrations Over Time
Useful Links
Nutrient Loading
The nutrient loading calculations are used based on daily inflow from each source and the representative nutrient concentrations. The annual storage is based on a mass balance approach which is represented in the figure and table below.